Lecture 17: Agricultural Export Promotion Organizations
Econ 2203 | International Trade and Policy in Agriculture
Department of Development Economics
2026-08-15
The Institutional Architecture of India’s Agri Exports
India’s agricultural export performance does not emerge spontaneously from market forces. It is shaped by a dense ecosystem of statutory bodies, commodity boards, and promotional agencies working in parallel.
Three tiers of the ecosystem:
Tier 1 — Apex Mandate Bodies:
APEDA and MPEDA cover the broadest range of products
Tier 2 — Commodity-Specific Boards:
Tea, Coffee, Rubber, Spices, Tobacco Boards target specific value chains
Tier 3 — Quality and Finance Infrastructure:
EIC (certification), EXIM Bank (trade finance), ECGC (risk cover)
India’s agri export organizations at a glance:
| Body | Est. | Ministry |
|---|---|---|
| APEDA | 1985 | Commerce |
| MPEDA | 1972 | Commerce |
| Tea Board | 1953 | Commerce |
| Coffee Board | 1942 | Commerce |
| Spices Board | 1987 | Commerce |
| Rubber Board | 1947 | Commerce |
| Tobacco Board | 1976 | Commerce |
| EIC | 1964 | Commerce |
| EXIM Bank | 1982 | Finance |
| ECGC | 1957 | Finance |
APEDA: Mandate and Structure
APEDA — Agricultural and Processed Food Products Export Development Authority
- Established under the APEDA Act, 1985
- Under the Ministry of Commerce and Industry
- Headquarters: New Delhi; 13 regional offices across India
Scheduled products:
APEDA covers 14 scheduled product groups including fresh produce, processed foods, meat, dairy, cereals, and marine products (see APEDA Act Schedule).
APEDA’s scheduled products cover ~60% of India’s agricultural export basket by value. Rice (basmati) alone accounts for $5.8B of APEDA’s promoted exports.
APEDA’s governing structure:
- Chairperson: IAS officer (Secretary-level appointment)
- Governing Board: 25 members — government, industry, research, farmers
- Annual budget: ~₹650 crore (FY2025)
Funding mechanism:
APEDA collects a cess on APEDA-scheduled exports (₹2 per quintal for most commodities) which funds Market Development Assistance (MDA) grants for trade fair participation, pack houses, and quality testing.
APEDA Scheduled Product Exports: FY2024
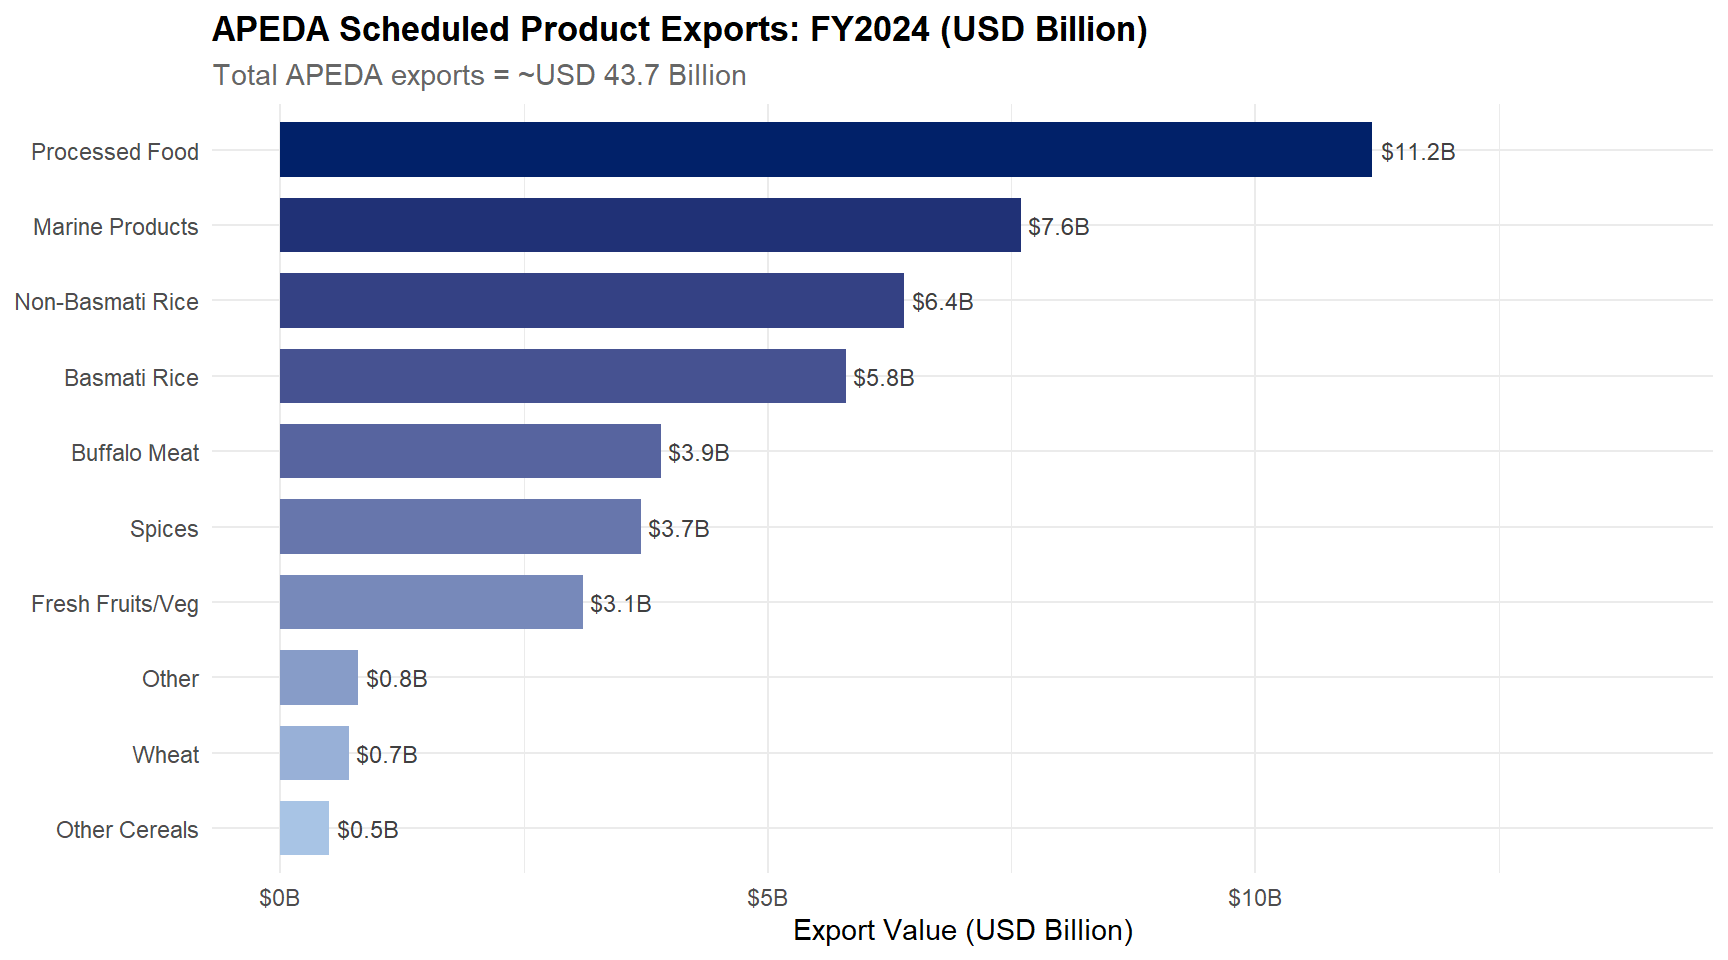
Figure 1: Processed food is the single largest APEDA export category; marine products rank second. Rice (basmati + non-basmati) together constitute ~28% of the basket. Source: APEDA Annual Report 2023-24.
APEDA’s Key Functions in Practice
1. Financial Assistance (MDA Grants):
- Infrastructure: pack houses, pre-cooling facilities, CA stores, vapour heat treatment (VHT) plants — subsidy up to 50% of cost (cap ₹50 lakh–₹3 crore)
- Quality labs: NABL accreditation support; pesticide residue testing equipment
- Market promotion: 75% reimbursement of stall cost at international fairs
2. Quality Standards:
- Issues guidelines for pesticide residue management (grape, mango protocols)
- Coordinates NABL-accredited testing laboratories for certifying shipments
- Manages Generic India brand (Incredible India! branding at trade fairs)
4. Bilateral Market Access Protocols:
Market access for perishables requires country-to-country pest risk assessment (PRA). APEDA negotiates these protocols:
| Protocol | Country | Product |
|---|---|---|
| VHT Protocol | Japan | Mango (Alphonso) |
| Cold Treatment | South Korea | Grapes |
| Systems Approach | USA | Mangoes |
| Residue Monitoring | EU | Grapes, pomegranate |
The Japan mango success story:
APEDA negotiated a vapour heat treatment (VHT) protocol with Japan’s Ministry of Agriculture (MAFF) in 2006. Indian mango exports to Japan grew from near-zero to $50+ million in FY2024.
Top 10 Destinations for India’s Agricultural Exports
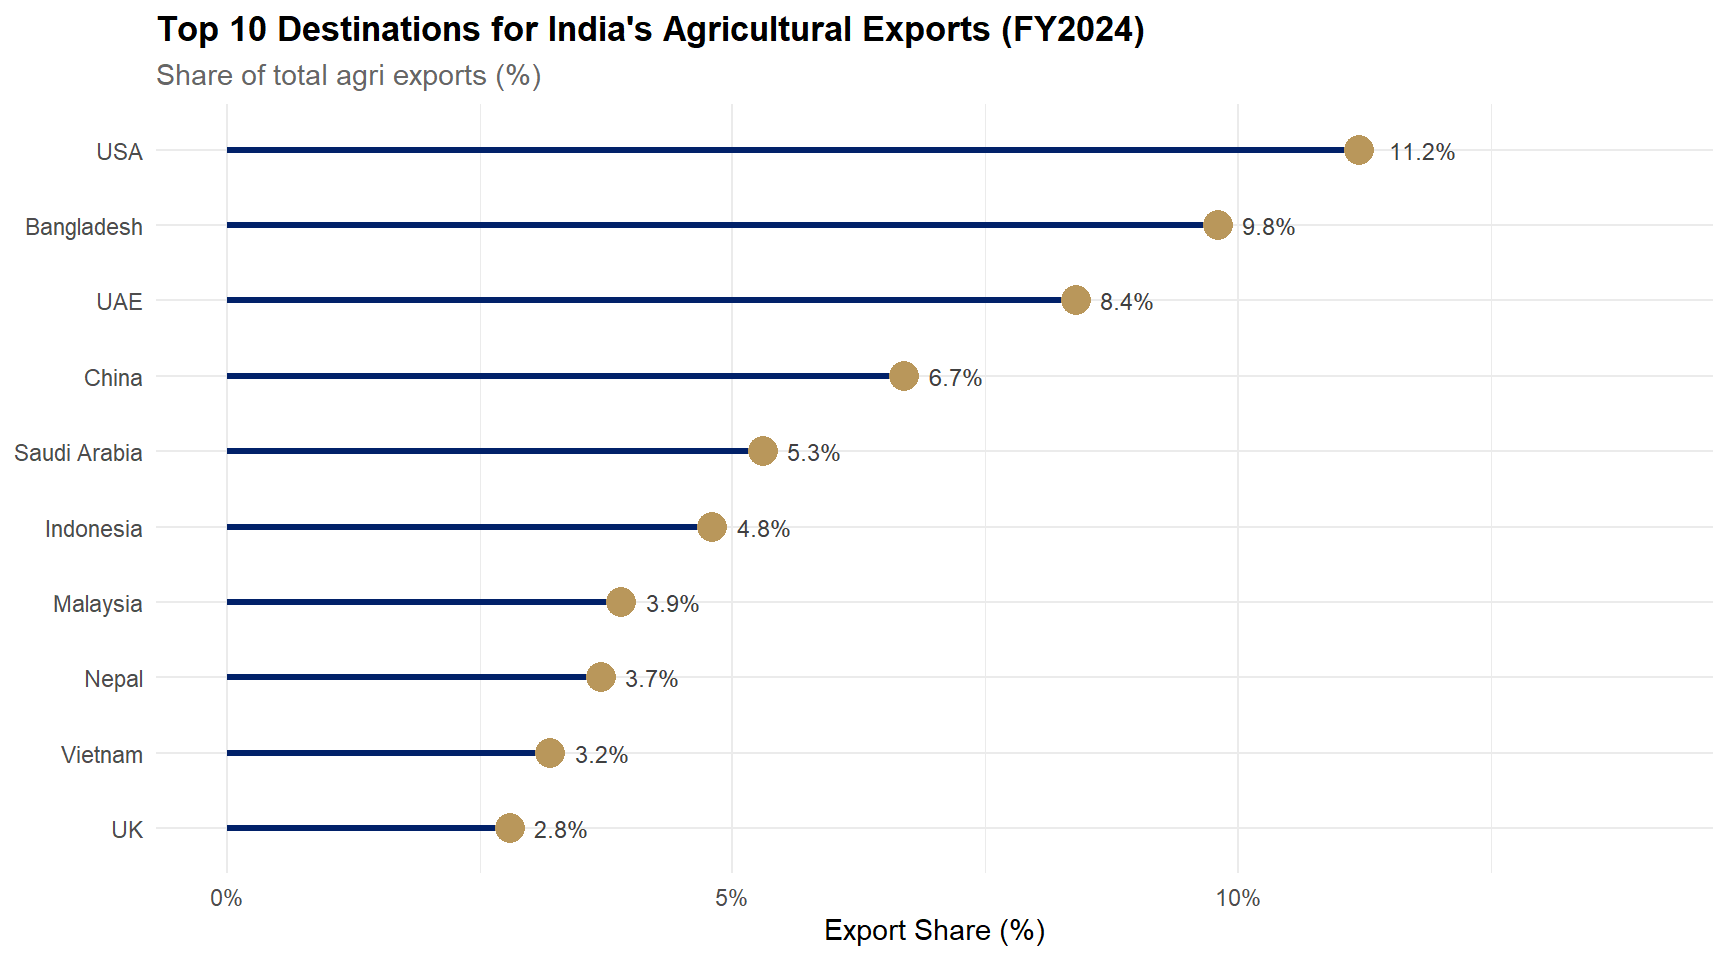
Figure 2: USA leads with 11.2% share driven by marine products and spices; Bangladesh and UAE are the next largest markets for rice and meat exports. Source: APEDA Annual Report 2023-24.
APEDA’s Success Metrics: Selected Achievements
Basmati Rice:
- FY2010 export: $1.5 billion
- FY2024 export: $5.8 billion (50+ destinations)
- APEDA’s GI application for Basmati at WTO (ongoing): protects brand value
- APEDA basmati traceability: QR code on bags linking to farm, miller, testing report
Organic Exports:
- FY2024: $1.1 billion (50+ countries)
- India: 4th largest organic area globally (4.43 million ha, 4.5 million farmers)
- APEDA manages NPOP (National Programme for Organic Production) — certification, accreditation
- USA (37%) and EU (35%) are top organic destinations
Fresh Grapes (EU):
- EU had threatened ban due to pesticide residues (2014 crisis)
- APEDA’s Grape Net portal: farmer-level residue monitoring of 1.5 lakh acres
- Residue violations reduced from 180 (2013) to 9 (FY2024)
- Grape exports: $260 million FY2024; sustained EU market access
APEDA trade fair presence:
| Fair | Location | India Stall |
|---|---|---|
| Gulfood | Dubai, Feb | ~400 exhibitors |
| SIAL | Paris, Oct | ~150 exhibitors |
| Annapoorna | Mumbai | Domestic + buyers |
| FMI Show | Chicago | Marine, organic |
| WorldFood | Moscow | Basmati, spices |
APEDA’s “India Pavilion” concept — government-funded stall space offered to SME exporters at subsidised rates. In FY2024, APEDA facilitated participation of 3,200 exporters across 47 international fairs.
India Agricultural Exports: Long-run Trend
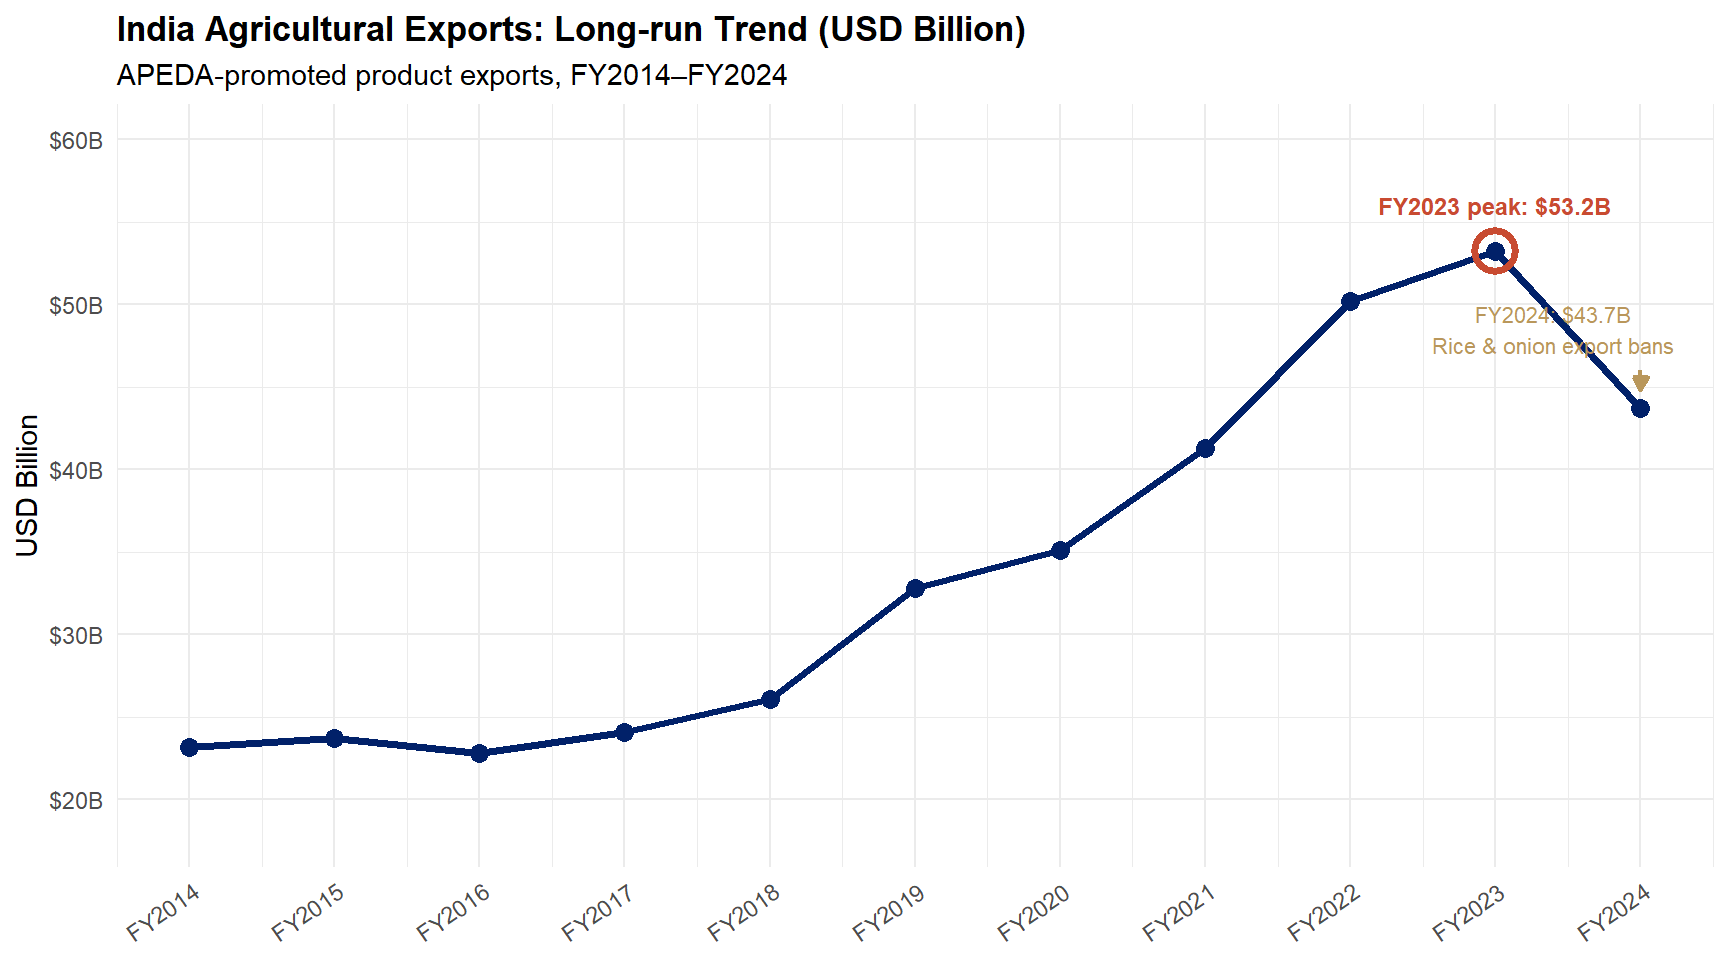
Figure 3: India’s APEDA-promoted exports grew 2.3x from FY2014 to the FY2023 peak of 53.2B USD, before declining to 43.7B in FY2024 after non-basmati rice and onion export bans. Source: APEDA Annual Report 2023-24.
MPEDA: India’s Seafood Export Authority
MPEDA — Marine Products Export Development Authority
- Established under MPEDA Act, 1972
- Ministry of Commerce and Industry
- Headquarters: Kochi, Kerala; offices in all coastal states
India’s seafood exports (FY2024):
- Total: $7.6 billion (3.5 million MT)
- India: 4th largest seafood exporter globally (after China, Norway, Vietnam)
- Shrimp: 66% of export value
- Top markets: USA (24%), EU (22%), China (14%), Japan (8%), Southeast Asia (7%)
Product mix:
Frozen shrimp · Dried fish · Frozen fish (ribbonfish, pomfret) · Cephalopods (squid, cuttlefish, octopus) · Fresh/chilled fish · Seaweed · Surimi
Andhra Pradesh contributes 70% of India’s shrimp exports — the largest concentration of aquaculture in the world outside China.
MPEDA’s registration system:
All marine product exporters must register with MPEDA. As of FY2024:
- Processing plants: 1,200+ (EU-approved: 350+)
- Hatcheries: 2,800
- Aquaculture farmers linked: ~1.2 million
Traceability and CoC (Chain of Custody):
MPEDA’s CoC system tracks shrimp from farm pond to export container:
- Farm registration (GPS-tagged)
- Feed purchase records (antibiotic-free)
- Harvest sampling (NRCP residue test)
- Processing plant records
- Container ID linked to farm batch
This traceability is required for EU and USA market access — buyers can scan a QR code and trace any pack of Indian shrimp to the source farm.
MPEDA: Quality Systems and International Compliance
National Residue Control Plan (NRCP):
The EU requires all third-country seafood exporters to operate an NRCP — a systematic national programme testing for:
- Antibiotics (nitrofurans, chloramphenicol, tetracyclines)
- Heavy metals (mercury, lead, cadmium)
- Pesticide residues
MPEDA coordinates NRCP testing across states: - 18,000+ samples per year - Tested at CIFT, EIC, and NABL labs - Annual audit by EU’s DG-SANTE (Health and Food Safety)
Result: EU has kept Indian seafood on its approved list continuously since 2006 (minor suspension in 2002 was reversed after MPEDA reforms).
USA FDA import alerts — India’s challenge:
The USA FDA has issued import alerts on Indian shrimp over antibiotic residues multiple times.
2022 import alert: 46 Indian processing plants placed under increased surveillance; exports to USA dipped 8% in FY2023.
MPEDA’s response: - Mandatory antibiotic-free certification for all USA-bound shrimp - MPEDA training for 50,000 Andhra farmers on prohibited antibiotics - 3rd party testing at NABL labs (EIC, SGS) before shipment
Outcome: USA-bound exports recovered to $1.8B in FY2024.
SPS compliance is not a one-time event — it requires continuous investment in testing, farmer training, and government–industry coordination.
The Five Commodity Boards: Overview
| Board | Est. | HQ | Key Products | FY2024 Export | Top Markets |
|---|---|---|---|---|---|
| Tea Board | 1953 | Kolkata | CTC tea, orthodox, green | ~$750M | Russia, UAE, UK |
| Coffee Board | 1942 | Bengaluru | Arabica, Robusta | ~$1.2B | Italy, Germany, USA |
| Rubber Board | 1947 | Kottayam | NR, latex, crepe | ~$250M | Germany, USA, Italy |
| Spices Board | 1987 | Kochi | Chilli, cumin, cardamom, pepper | ~$3.7B | China, USA, Vietnam |
| Tobacco Board | 1976 | Guntur | FCV tobacco, cheroots | ~$800M | Belgium, Germany, Russia |
All five boards perform similar functions: research, quality standards, market development, financial assistance, and export promotion. Each has a statutory role in the respective value chain — from regulating auctions (Tea, Tobacco) to issuing GI certificates (Spices Board for Alleppey Green Cardamom).
Tea Board of India
India’s tea sector:
- 2nd largest producer globally (after China): 1.35 billion kg/year (FY2024)
- Domestic consumption: ~1.1 billion kg (India is its own largest consumer)
- Exports: 200–250 million kg (~$750–800 million)
Tea Board functions:
- Regulates tea auctions: Kolkata, Guwahati, Coimbatore, Cochin auction centres
- Tea Research Association (Tocklai, Assam): oldest tropical crop research station in the world (est. 1911)
- Issues Tea Certificate for all shipments
- Darjeeling GI: world’s first GI-tagged tea (EU recognition 1995, India 2004). 87 registered gardens. ~7 million kg/year.
Top export markets: Russia (20%), UAE (18%), UK (12%), USA (7%), Germany (5%)
Challenges facing Indian tea:
- Competition: Kenya (low-cost CTC), China (premium green/white), Sri Lanka (strong Ceylon brand)
- Price stagnation: Assam CTC auction prices have grown only 4% annually since 2015 despite input cost inflation
- Climate risk: North Bengal tea gardens face erratic monsoon; 2023 drought cut Darjeeling first-flush yield by 30%
- Small-tea growers: 35% of tea production from 200,000+ small growers (< 10 ha) — difficult to comply with Rainforest Alliance/UTZ standards required by European retail chains
Tea Board response: Grameen Krishi Mitra (GKM) extension workers linking small growers to certification. Target: 50% certified by 2028.
Coffee Board and Spices Board
Coffee Board of India (est. 1942, Bengaluru):
- India: 3rd largest Arabica producer in Asia
- Production: ~350,000 MT/year
- Exports: $1.2 billion (FY2024) — record high; 15% growth over FY2023
- Arabica: Coorg, Chikmagalur (Bababudangiri GI); shade-grown, organic premium
- Robusta: Wayanad, Hassan; used in espresso blends globally
- Top markets: Italy (30%), Germany (18%), Belgium (12%), USA (9%)
- CCRI (Central Coffee Research Institute, Chikmagalur): disease-resistant variety development
- Specialty coffee promotion: India now at World Barista Championship; “Indian single origin” brand growing
Coffee Board’s Café Coffee Day predecessor was a Board initiative. Domestic coffee consumption now growing 7% annually — youngest coffee drinking demographic globally.
Spices Board of India (est. 1987, Kochi):
- India: world’s largest spice exporter by value
- 109 varieties; 8 million MT production; 4.5 million MT exports
- $3.7 billion (FY2024) — 5-year CAGR of 12%
Top export items (FY2024):
| Spice | Value |
|---|---|
| Chilli | $1.1B |
| Spice Oils & Oleoresins | $800M |
| Cumin | $720M |
| Turmeric | $200M |
| Cardamom | $150M |
| Pepper | $140M |
GI products: Alleppey Green Cardamom, Malabar Black Pepper, Guntur Sannam Chilli, Coorg Orange Cardamom. Premium over non-GI: 20–40% in EU market.
SPS challenge: EU raised MRL concerns on Indian chilli (Sudan Red dye, aflatoxin). Spices Board’s GAP training programme covers 500,000 chilli farmers in Andhra Pradesh.
Export Inspection Council (EIC)
EIC — statutory body under the Export (Quality Control and Inspection) Act, 1963
- Ministry of Commerce and Industry; HQ New Delhi
- Purpose: independent certification that Indian exports meet quality standards acceptable to importing countries
Structure:
- 5 regional EIOs (Export Inspection Offices): Mumbai, Chennai, Kochi, Kolkata, Delhi
- 40+ sub-offices in export-intensive centres (Vizag, Surat, Amritsar, Ludhiana)
- Accredited by EU’s DG-SANTE, USFDA, Japan MHLW, Korean MFDS
Mandatory certification products:
Fish and fishery products · Meat and meat products · Poultry products · Dairy products · Egg products · Honey · Organic products · Castor oil · Processed food (for EU, Japan, USA)
What EIC does per shipment:
- Document verification (invoice, packing list, test reports)
- Physical inspection: random sampling from lot
- Lab analysis: microbiological, chemical, pesticide, heavy metals
- Issuance of Health Certificate (format accepted by destination country)
- Post-shipment surveillance: tracks rejection reports from destination
EIC performance (FY2024):
- Certificates issued: 1.8 lakh
- Value covered: ₹1.1 lakh crore
- Rejection rate (border rejections at EU/USA): 0.4% (one of the lowest among major exporters)
- Turnaround time: 2–3 working days for most certificates
An FSSAI-EIC joint protocol (2022) has harmonised testing requirements so exporters need not test separately for domestic FSSAI and export EIC compliance.
NAFED: Price Stabilisation and Export Implications
NAFED — National Agricultural Cooperative Marketing Federation of India
- Established 1958; cooperative society under Multi-State Cooperative Societies Act
- Functions: Price Support Scheme (PSS) procurement, buffer stock management, retail distribution
PSS and its export connection:
When prices of oilseeds (mustard, groundnut, soybean) and pulses fall below MSP: - Government activates PSS; NAFED procures from farmers at MSP - NAFED accumulates buffer stocks of oilseeds/pulses - Stocks are sold through NAFED retail, e-commerce, and open market sales when prices rise - Procurement reduces export availability (absorbs domestic surplus before it can be exported); but stabilises farm incomes
In kharif 2023: NAFED procured 38 lakh MT of tur dal at MSP (₹6,600/quintal) from Karnataka, Maharashtra, Madhya Pradesh. This stock was later released to control prices — but reduced the quantity available for the export market in FY2024.
The NAFED export dilemma:
NAFED is not primarily an export organization — it is a price stabilisation agency. But its procurement and buffer management decisions directly affect India’s agri export supply.
Tension: When NAFED holds large tur dal stocks, export prices are firm because domestic supply is constrained. When NAFED releases stocks, domestic prices fall → farmer incomes hurt, but consumers benefit.
FPO linkage:
NAFED’s eMandis portal now links FPOs to government procurement at MSP and to private buyers. 1,200 FPOs linked as of FY2024, aggregating procurement from 2.5 million farmers.
AAPL (NAFED’s retail arm): sells agri commodities B2C through 1,200+ stores, Amazon/Flipkart — brand building for Indian agri.
Farmer Producer Organizations as Export Units
The small-farm problem:
India’s average farm size: 1.08 hectares (Agriculture Census 2015–16).
Average EU/USA buyer minimum order: 20 MT per lot.
No individual smallholder can meet buyer requirements for: - Consistent volume - Uniform quality and grading - Traceable production records - Third-party certification costs (organic, GlobalGAP)
FPOs as aggregators:
An FPO with 500 members × 1 ha each = 500 ha aggregate. Can produce 300–500 MT of a single crop — meeting buyer minimums.
Successful FPO export examples:
Mahagrapes (Maharashtra):
Cooperative of 46 grape-growing cooperatives, ~25,000 farmers.
Exports EU-compliant grapes to Netherlands, Germany, UK.
FY2024 exports: ~8,000 MT (~$40M).
Uses APEDA-funded pack houses and cold chain in Nashik.
Sahyadri Farms (Nashik):
12,000 farmer members; India’s largest single FPO.
GlobalGAP certified; supplies Tesco UK, Carrefour.
Own cold chain, pack house, CA storage.
NDDB dairy cooperatives:
Amul (GCMMF): 3.6 million farmer members; dairy exports to 50+ countries ~$500M.
APEDA’s FPO Connect: 1,200+ FPOs registered, linked to APEDA’s buyer database and MDA grant system. FPOs can now access MDA grants directly — not just through large exporters.
Government Schemes Supporting Agri Export Organizations
PM FME (Formalisation of Micro Food Enterprises) Scheme: - ₹10,000 crore over 5 years (2020–25) - Credit-linked subsidy (35%) for micro-enterprises upgrading to FSSAI standards - ODOP (One District One Product) focus products receive priority - 2 lakh+ enterprises formalized by FY2024 → many now eligible for export
NABARD’s Agri Infrastructure Fund (AIF): - ₹1 lakh crore; 3% interest subvention - Pack houses, cold stores, CA chambers, primary processing centres - Linked to FPO and cooperative projects — directly supports export infrastructure
SFAC (Small Farmers Agribusiness Consortium): - FPO promotion, equity grant support - Connects FPOs to APEDA/MPEDA registered exporters - Pilot: 100 agri export FPOs linked directly to 3 commodity board markets
APEDA-NHB Horticulture Export Collaboration:
NHB (National Horticulture Board) funds pack houses; APEDA funds market promotion. Joint program in: - Banana (Jalgaon, Maharashtra → Middle East) - Guava (Allahabad, UP → UK diaspora market) - Litchi (Muzaffarpur, Bihar → EU, West Asia)
Districts as Export Hubs (DEH) — FTP 2023–28:
Commerce Ministry has identified 100+ districts with specific “champion products.”
Examples: - Kalaburagi (Karnataka): Tur dal - Nashik (Maharashtra): Grapes, onions - Tirupur (Tamil Nadu): Knitwear + agri - Coorg (Karnataka): Coffee, pepper - Guntur (Andhra Pradesh): Chilli, turmeric
District Collectors coordinate between farmers, FPOs, exporters, and commodity boards. Target: every DEH district to double export value in 5 years.
India’s 2030 Agricultural Export Ambition
APEDA’s target: $60 billion by 2030 (from $43.7B in FY2024; CAGR ~5.4%)
National agri-food export target (FTP 2023–28): $100 billion by 2030
Strategy pillars: 1. Diversify beyond rice dominance 2. Open new markets: Africa, Southeast Asia, South Korea 3. Value addition: processed, organic, functional foods 4. Invest in cold chain: PM GatiShakti nodes 5. Leverage GI brand premiums
Key Takeaways:
- APEDA is the backbone of India’s agri export promotion — covers 60% of the export basket
- MPEDA manages India’s $7.6B seafood export with rigorous quality systems essential for EU/USA access
- Commodity Boards are sector-specific engines — Spices Board’s $3.7B is remarkable for a relatively small value chain
- EIC provides the third-party quality assurance without which EU/USA market access is impossible
- FPOs are solving the small-farm aggregation problem — Mahagrapes, Sahyadri, Amul show it is achievable at scale
Next Lecture
Lecture 18 — India’s Agricultural Trade and Foreign Trade Policy
August 22, 2026 — FINAL LECTURE
- Course synthesis: from comparative advantage to India’s $43.7 billion agri export reality
- India’s trade performance: FY2024 big picture and 10-year trends
- Foreign Trade Policy 2023–28: vision, themes, and agricultural provisions
- Millets, GIs, and organic exports as strategic niches
- The farmer welfare vs export competitiveness dilemma
Appendix
Additional Resources
Further Reading
- Lecture notes and APEDA/WTO official documents
- APEDA Annual Report 2023-24
- RBI/DGCI&S/APEDA databases for latest data
Key Data Sources
- DGCI&S: India’s merchandise trade
- RBI: Balance of payments data
- APEDA: Agricultural export statistics
- WTO: Tariff and trade databases
Econ 2203 | International Trade and Policy in Agriculture