Lecture 14: Agreement on Agriculture
Econ 2203 | International Trade and Policy in Agriculture
Department of Development Economics
2026-07-25
Recap: Lecture 13
Lecture 13 established the WTO as the institutional framework of international trade.
Key ideas from Lecture 13:
- GATT → WTO (1995): from provisional to permanent
- Five core principles: MFN, National Treatment, Bound Tariffs, Reciprocity, Transparency
- DSU: binding dispute settlement
- India’s Peace Clause — protects MSP procurement
- Doha Round stalemate: agriculture at the core
Today’s Focus
We zoom into the Agreement on Agriculture (AoA) — the specific WTO text that governs how much protection India can give its farmers, how much support the US/EU can give theirs, and how agricultural trade is managed globally.
Three pillars: Market Access · Domestic Support · Export Competition
Why Was the AoA Needed?
Pre-Uruguay Round Agriculture: A Wild West
Before 1995, agriculture was essentially outside GATT discipline:
- USA had a 1955 GATT waiver exempting its agricultural support programs
- EU’s Common Agricultural Policy (CAP): massive production and export subsidies
- Result: global overproduction of wheat, butter, sugar; chronic dumping on world markets
The dumping problem: In the 1980s, EU butter was sold on world markets at 20% of EU domestic prices. US wheat exports were subsidised by up to 40%. This depressed world prices and hurt farmers in Australia, Argentina, Brazil, India, and the developing world.
Why This Hurt India
Artificially low world prices for wheat and rice: - Made Indian exports uncompetitive - Provided cheap food imports that undercut domestic prices - Reduced incentives for agricultural investment globally
The AoA’s promise to the developing world: - Discipline US/EU subsidies - Reduce import barriers - Eliminate export subsidies
Reality: progress has been slow — but the framework now exists.
AoA Structure: The Three Pillars + S&DT
Agreement on Agriculture (1995) — 21 Articles + Annexes In force: January 1, 1995 | Implementation period: 1995–2004 (developed), 1995–2005 (developing)
Agreement on Agriculture (1995)
- Pillar 1: Market Access
- Tariffication of non-tariff barriers
- Bound tariff schedules
- Tariff reduction commitments (average 36%)
- Minimum access provisions (3–5% of domestic consumption)
- Special Safeguard (SSG) clause
- Pillar 2: Domestic Support
- Aggregate Measurement of Support (AMS) reduction (20% for developed, 13.3% for developing)
- Green Box: non-distorting (exempt)
- Blue Box: production-limiting (exempt)
- Amber Box: trade-distorting (limited)
- De minimis provisions
- Pillar 3: Export Competition
- Export subsidy reduction/elimination
- Export credit disciplines
Special and Differential Treatment (S&DT)
Developing countries get: - Longer implementation periods (10 vs. 6 years) - Smaller reduction commitments (24% vs. 36% tariff cuts; 13% vs. 24% domestic support cuts) - Higher de minimis thresholds (10% vs. 5%) - Continued input subsidies for poor farmers - Continued investment subsidies for agricultural development
India fully utilises all S&DT provisions
Pillar 1 — Market Access
Tariffication: Converting NTBs to Tariffs
What is Tariffication?
Before 1995: Countries protected agriculture through: - Import quotas (how much can come in) - Variable levies (duty adjusts to keep domestic prices stable) - Minimum import prices - Voluntary export restraints
AoA Article 4: All these NTBs converted to tariff equivalents (bound tariff rates in WTO schedules) by 1995.
The Reduction Commitment:
| Country | Average Cut | Minimum/Product | Period |
|---|---|---|---|
| Developed | 36% | 15% | 6 years |
| Developing | 24% | 10% | 10 years |
| LDCs | None | None | — |
“Dirty Tariffication”
Many developed countries set artificially high tariff equivalents when converting their NTBs — overstating the protection level to preserve policy space.
Example: Canada’s tariff on butter: 298%; on chicken: 238%
This gave rich countries huge “water in the tariff” even after the required cuts.
India negotiated high bound rates (113% average) for similar reasons — policy space for future flexibility.
AoA Tariff Reduction Commitments
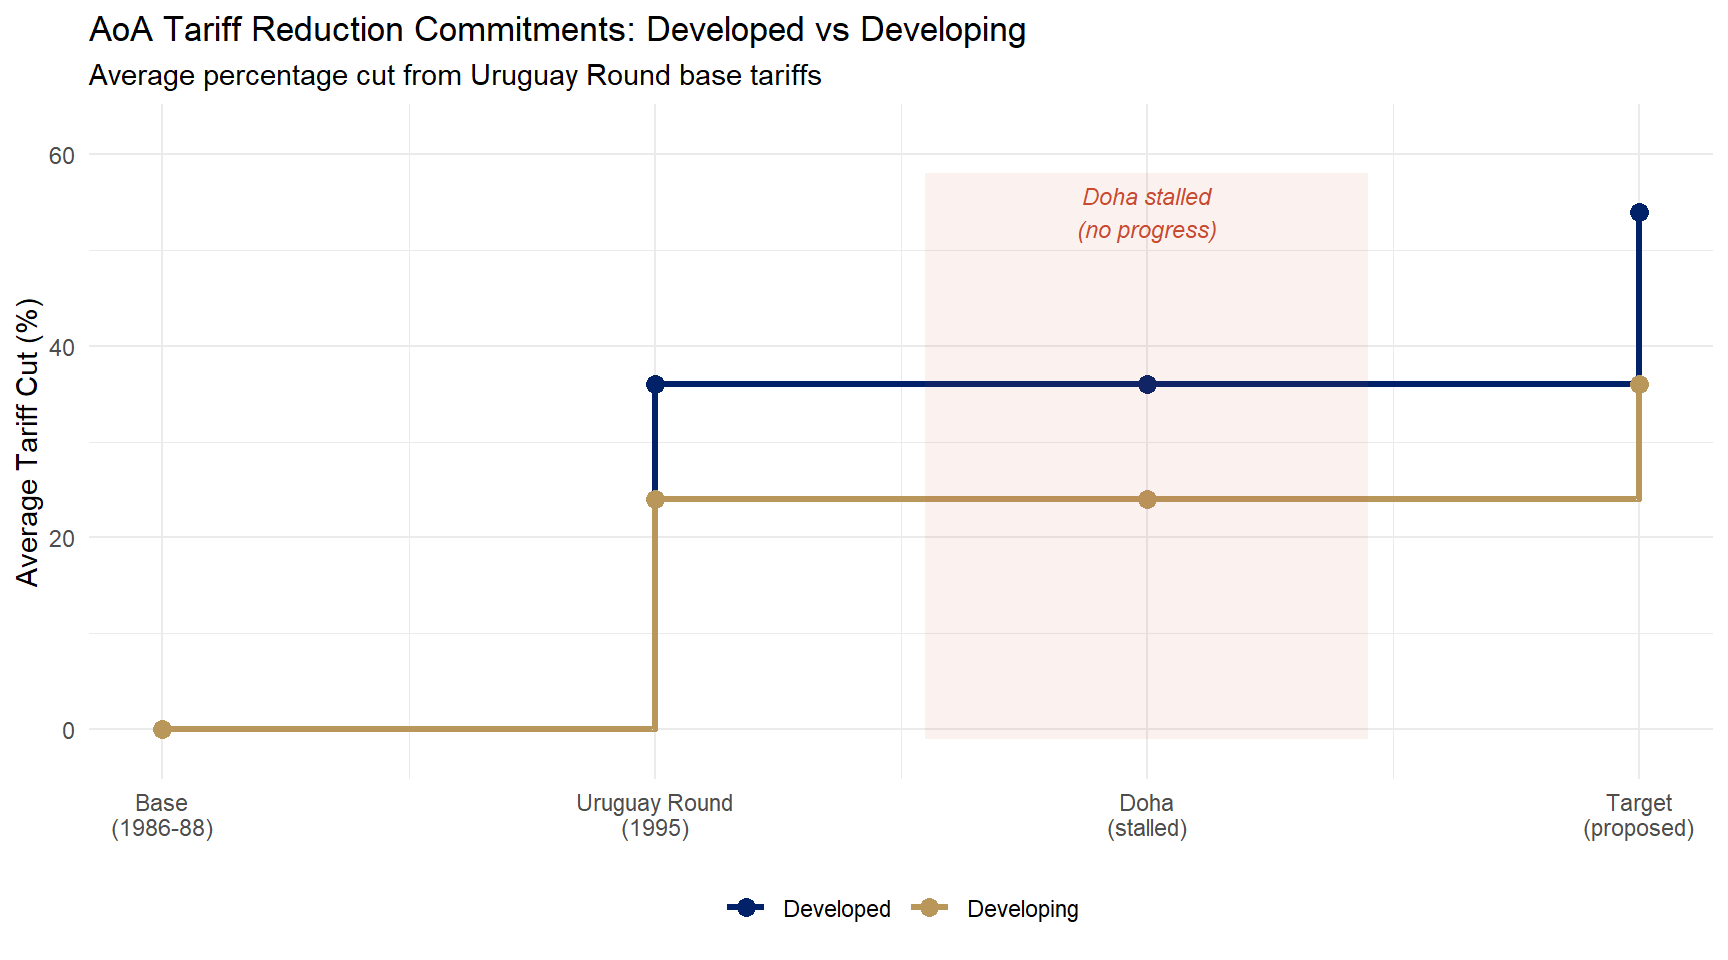
Figure 1: AoA Tariff Reduction Commitments: Developed vs Developing Source: WTO, Agreement on Agriculture; UNCTAD.
Tariff Rate Quotas (TRQs)
How TRQs Work
Where post-tariffication tariffs were extremely high, TRQs were created to ensure minimum market access:
- In-quota tariff: lower rate (e.g., 15%) applied to a specified quantity
- Out-of-quota tariff: higher rate (e.g., 60%) applied to quantities above the quota
Imports
  ↑
  │ Out-of-quota tariff = 60%
  │ ───────────────────────────
  │ In-quota tariff = 15%     ← TRQ fills here
  └─────────────────────────→ Volume
        Quota quantity
Minimum access commitment: 5% of domestic consumption by end of implementation period
India’s TRQ Commitments
India has TRQs for:
| Product | In-quota rate | Out-of-quota |
|---|---|---|
| Wheat | 50% | 100% |
| Rice (non-PDS) | 70% | 80% |
| Maize | 15% | 60% |
| Sunflower oil | 100% | 100% |
| Cotton | 5% | 10% |
Most Indian TRQ quotas are never filled — because even the in-quota tariff is high enough to limit imports below the quota. India’s TRQs are symbolic: the real protection is the bound tariff, not the TRQ.
India’s Bound Tariffs: Agricultural Products
“Water in the Tariff” — India’s Policy Flexibility
| Product | Bound (%) | Applied (2024, %) | Water (%) |
|---|---|---|---|
| Rice | 80 | 25 | 55 |
| Wheat | 100 | 40 | 60 |
| Maize | 60 | 50 | 10 |
| Sugar | 150 | 100 | 50 |
| Crude palm oil | 300 | 100 | 200 |
| Refined palm oil | 300 | 100 | 200 |
| Chickpeas | 100 | 50 | 50 |
| Milk powder (SMP) | 60 | 30 | 30 |
| Onions | 100 | 0 | 100 |
How India Used This Space — Palm Oil
In 2018–19, domestic oilseed farmers (soybean, groundnut, sunflower) were hurt by cheap imported palm oil from Malaysia and Indonesia.
India raised the applied tariff on crude palm oil from 30% to 100% (still below bound 300%).
This protected domestic edible oil industry without violating WTO — no dispute case possible.
Then in 2021, India lowered it again to reduce consumer food prices during inflation. Flexible policy instrument.
The large tariff “water” is India’s most important defensive trade policy instrument for agriculture
Special Safeguard (SSG) vs. SSM
Special Safeguard (SSG) — AoA Article 5
Allows additional tariff duties automatically (no injury investigation needed) when: - Volume trigger: imports exceed 125% of average imports in previous 3 years; OR - Price trigger: import price falls more than 10% below average 1986–88 price
Only available to countries that tariffied their NTBs — mainly developed countries and a few developing countries that had NTBs pre-1995.
India cannot invoke the SSG on most products because India used high bound tariffs, not tariffication of all NTBs. India has SSG access for only ~6 products.
Special Safeguard Mechanism (SSM)
What developing countries want (Doha)
An SSM would allow all developing countries to temporarily raise tariffs beyond bound levels when imports surge or prices fall — without the SSG’s historical eligibility restriction.
Key disagreement (2008 collapse): At what threshold can the SSM be triggered? USA wanted 140% of import volume; India demanded 110%.
SSM not agreed — one of the main reasons the Doha Round collapsed.
Pillar 2 — Domestic Support
Aggregate Measurement of Support (AMS)
What is AMS?
A measure of the total trade-distorting domestic support given to agriculture by a government.
Formula for product-specific AMS:
\[\text{AMS} = (\text{Administered Price} - \text{FERP}) \times \text{Eligible Production}\]
where: - Administered Price = MSP or procurement price - FERP = Fixed External Reference Price (average world price, 1986–88) - Eligible Production = quantity actually purchased at administered price
Non-product-specific AMS: Sum of general input subsidies (fertiliser, power, irrigation, credit) across all crops
Why the FERP is controversial
The FERP is fixed at 1986–88 world prices — when US and EU subsidies were at their peak, artificially depressing world prices.
Rice FERP: USD 116/tonne (1986–88 world price)
Current world price (2024): ~USD 450–500/tonne
So the “ceiling” against which India’s MSP is measured is a 40-year-old, distorted baseline. India argues this systematically overestimates India’s support and underestimates rich country support.
Developing country de minimis: 10% of production value (5% for developed countries)
The Three Boxes: Traffic Light Analogy
🟢 GREEN BOX
Allowed — no limit
Criteria: - Government-funded - No price support - Minimal trade distortion
Includes: - Agricultural research - Extension services - Pest/disease control - Infrastructure - Food security stockholding (with conditions) - Decoupled income support - Environmental programs
🔵 BLUE BOX
Permitted conditionally
Payments under production-limiting programs
Used primarily by EU (old area payments) and USA (counter-cyclical payments tied to historical acreage, not current production)
Less relevant for India — India doesn’t formally claim Blue Box, though some argue certain schemes could qualify
🟡 AMBER BOX
Restricted — must not exceed AMS commitment
All trade-distorting support: MSP procurement, input price subsidies tied to specific products
Subject to de minimis threshold: - Product-specific: 10% of that product’s value - Non-product-specific: 10% of total agri output value
India’s AMS commitment: India has no scheduled AMS reduction commitment — it must only stay within de minimis (10%)
India’s Agricultural Support by WTO Box
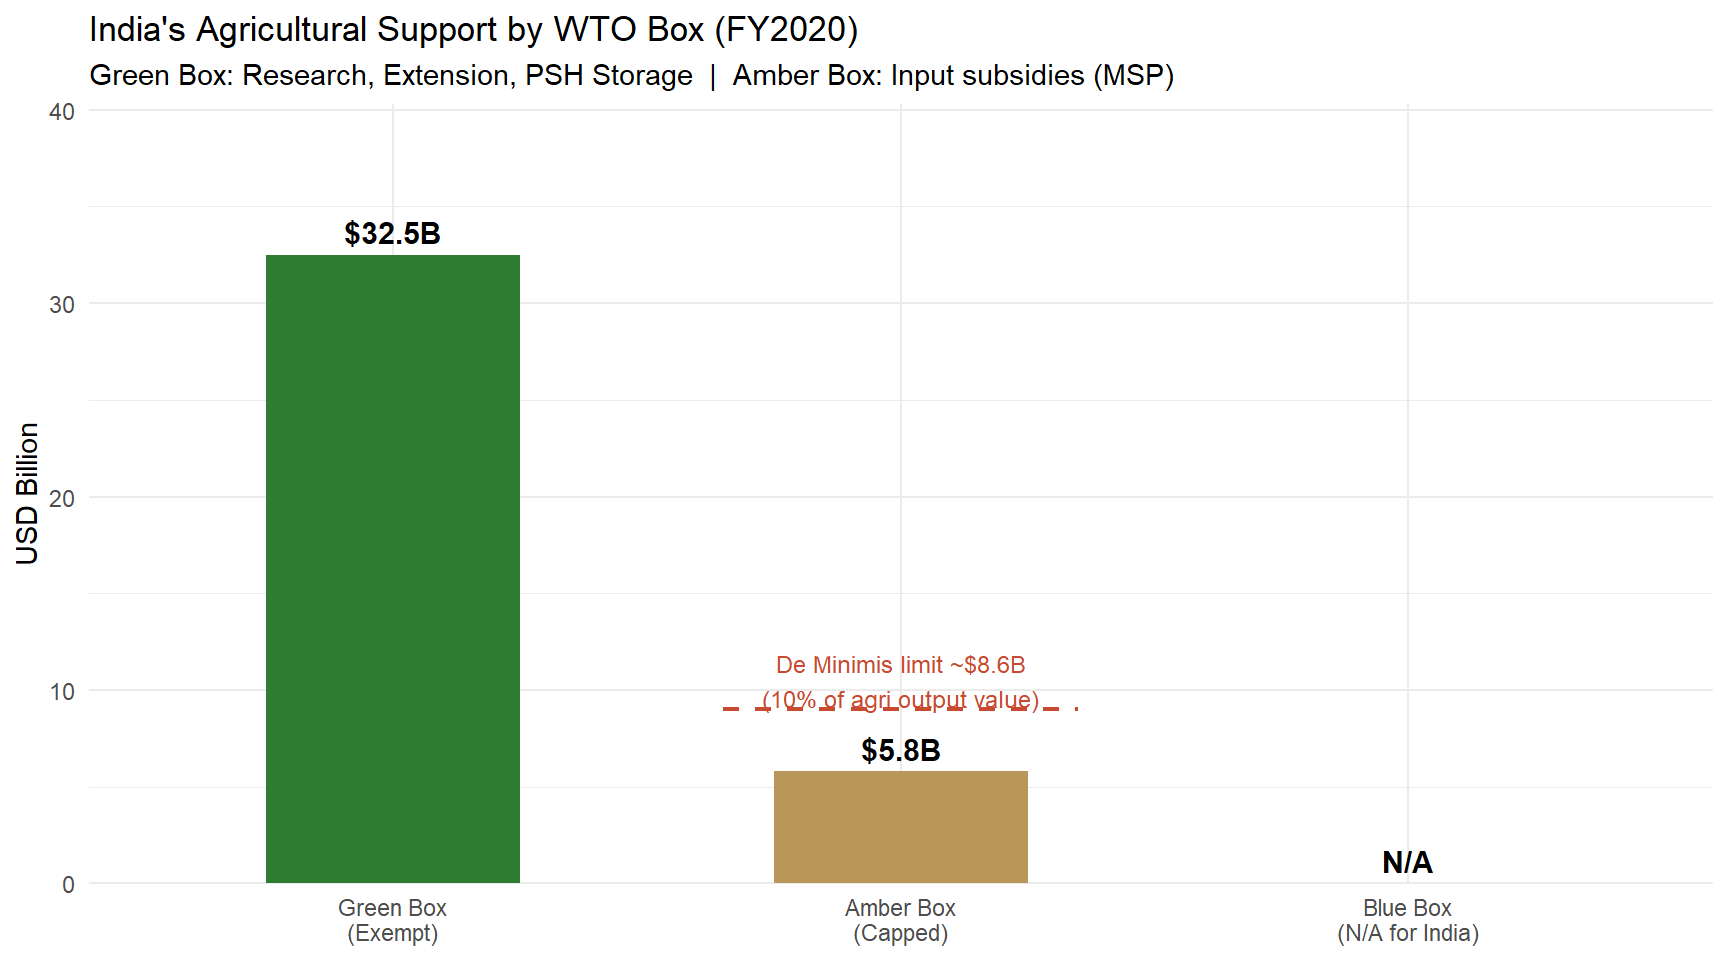
Figure 2: India’s Agricultural Support by WTO Box (FY2020) Source: India’s WTO Domestic Support Notifications; Ministry of Agriculture, GoI.
Green Box: What India Can and Cannot Claim
India’s Legitimate Green Box Programs
Programs India can legitimately classify as Green Box:
- ICAR research programs — rice varieties, disease resistance, HYV seeds
- Krishi Vigyan Kendras (KVKs) — 731 farm science centres across India
- Agricultural extension services — ATMA, ARYA programs
- National Food Security Act — food security stockholding (subject to conditions)
- Pradhan Mantri Krishi Sinchayee Yojana — irrigation infrastructure
- PM-KISAN — ₹6,000/year decoupled income transfer to 110 million farmers
- Crop insurance (PMFBY) — part may qualify as decoupled
What India CANNOT Claim as Green Box
MSP procurement system is NOT Green Box because:
- It involves price support (FCI buys at above-market MSP)
- It is linked to the quantity produced and sold to government
- It distorts production decisions — farmers produce more rice/wheat for FCI procurement than they would at market prices
→ MSP procurement falls in the Amber Box → Subject to de minimis limit → Protected only by Peace Clause
PM-KISAN, if truly decoupled (paid regardless of what crop is grown or how much), is a legitimate Green Box payment. India has been expanding this.
India’s Amber Box Challenge: The Numbers
Calculating India’s Rice AMS (FY2023–24)
| Item | Value |
|---|---|
| MSP for paddy (common) | ₹2,183/quintal ≈ USD 26.3/quintal |
| FERP (1986–88 world price) | USD 116/tonne = USD 11.6/quintal |
| Support per quintal | USD 26.3 − USD 11.6 = USD 14.7/quintal |
| Total procurement by FCI | ~42 million tonnes |
| Total rice AMS | USD 14.7 × 420,000 quintals per tonne… |
Calculation: USD 14.7/quintal × 420 million quintals = ~USD 6.2 billion
De minimis limit (10% of rice production value): Rice output ~120 MT × ~USD 250/tonne = USD 30B × 10% = ~USD 3 billion threshold
India’s rice AMS (USD 6.2B) exceeds the de minimis limit (USD 3B)
Why India Is Technically in Violation
India’s rice AMS exceeds its 10% de minimis limit. Without the Peace Clause:
→ Any WTO member could bring a dispute case → Panel could find India in violation → India would need to either cut MSP or reduce procurement
This is why the Peace Clause is not optional for India — it is existential for India’s food security architecture.
India’s counter-argument: Update the FERP to current world prices. AMS would then be negative (MSP < current world price for rice and wheat).
Peace Clause: Technical Details
Bali Ministerial Decision on Public Stockholding (MC9, December 2013 — India’s biggest recent WTO win)
Conditions for Peace Clause protection:
- Program existed before December 31, 2013 (India’s FCI procurement qualifies)
- Annual notification to WTO Committee on Agriculture with detailed data on:
- Stocks procured, average prices, distribution
- Assessment of trade distortion impact
- Stocks not exported below acquisition cost — cannot be used to dump food on world markets
- Program targets the poor — National Food Security Act 2013 explicitly does this (75% rural, 50% urban population)
India has notified its public stockholding program every year since 2013
The Permanent Solution Problem
MC10 Nairobi (2015): “Ministerial Decision affirms that the Peace Clause will remain in force until a permanent solution is found.”
Committed to permanent solution by MC11 (2017) — missed.
Each subsequent MC: reaffirmed commitment — no solution.
India’s demands for permanent solution: 1. Update FERP to current world prices OR base year of 2014–16 2. Include food inflation adjustment 3. No conditions on which crops qualify
The FERP update would essentially solve India’s problem — at current world prices, India’s MSP is often below market, making AMS negative. USA/EU resist this change as it would expose their own support programs.
Non-Product-Specific Support: India’s Fertiliser Subsidy
The Fertiliser Subsidy Problem
India’s fertiliser subsidy (FY2023–24): ₹2.25 lakh crore (~USD 27 billion)
This is a non-product-specific subsidy — available to all crops, not tied to any specific commodity.
Goes into the non-product-specific AMS pool:
| Subsidy | Approximate Value (FY24) |
|---|---|
| Fertiliser | ₹2,25,000 crore |
| Power subsidy to agriculture | ₹80,000–90,000 crore |
| Irrigation water subsidy | ₹30,000 crore |
| Agri credit subvention | ₹20,000 crore |
| Total NPS AMS | ~₹3.5–4.5 lakh crore |
India’s WTO Argument
Non-product-specific AMS de minimis: 10% of total agricultural output value
India’s total agri GVA (2023–24): ~₹24 lakh crore (~USD 288B)
De minimis threshold: USD 28.8 billion
India’s total NPS support: ~USD 42–55 billion
→ India likely exceeds NPS de minimis too
India’s defence: - Most subsidies benefit small/marginal farmers (eligible for S&DT input subsidies) - Investment subsidies for agriculture exempt per AoA Annex 2 - S&DT permits input subsidies for low-income resource-poor farmers
India has never submitted a formal AMS notification to WTO — technically still in “due restraint” (pre-Bali practice). This opacity is itself a WTO violation risk.
Pillar 3 — Export Competition
Export Subsidies: History and Elimination
AoA Article 9 — Export Subsidy Disciplines
Original Uruguay Round commitments (developed countries): - Reduce export subsidy value by 36% (from 1986–90 base) - Reduce subsidised export volumes by 21% - Over 6-year implementation period
Developing countries: 24% value cut, 14% volume cut over 10 years
What counted as export subsidies: Direct payments, government stock selling below cost, export credit at below-market rates, food aid as export dumping, payments to marketing boards for exports
Nairobi MC10 (December 2015): Developed countries committed to eliminate export subsidies immediately for most products (by end-2018 for almost all). Developing countries: 2023 for most, 2018 for some.
Who Were the Big Offenders?
EU Common Agricultural Policy: Peak export subsidy bill (1992): €10 billion/year Used to export surplus wheat, butter, cheese, beef, and sugar at 40–60% below domestic prices.
Hurt: Argentina (wheat), Australia (dairy), Brazil (sugar), India (rice, cotton)
USA: Export Enhancement Program (EEP) subsidised wheat exports to Eastern Europe and developing countries
Both programs dramatically wound down after AoA and Nairobi — a genuine WTO success story
The elimination of EU and US agricultural export subsidies (largely achieved by 2020) is one of the AoA’s real achievements — reduced price depression in world markets
India’s Export Support: WTO Legal?
India Does Not Have Scheduled Export Subsidy Commitments
India never committed to reduce or eliminate export subsidies in its WTO schedule — because India historically didn’t use them. This gives flexibility.
But India has used export support programs:
MEIS (Merchandise Exports from India Scheme): - Duty credit scrips for exporters - USA challenged it in DS541 (2019) - WTO Panel ruled MEIS violated AoA export subsidy disciplines - India discontinued MEIS - Replaced by RoDTEP (Remission of Duties and Taxes on Export Products)
RoDTEP: India’s Current Export Support
India’s argument: RoDTEP is a legitimate tax refund — it refunds embedded taxes that cannot be claimed back otherwise (state levies, mandi taxes, electricity duty). This is NOT a subsidy but a correction of tax cascading.
WTO principle: Exported goods should not bear domestic taxes. Duty drawback is permitted.
If RoDTEP refunds only actual embedded taxes (no more, no less), it is WTO-consistent.
Risk: If rates are set above actual embedded taxes, the excess becomes a subsidy.
APEDA, MAI, TMA schemes (marketing assistance) — India argues these are Green Box general services (market promotion, not direct export subsidies)
Export Restrictions: AoA Article 12
When India Bans Agricultural Exports
AoA Article 12: When imposing food export restrictions or prohibitions for food security: 1. Notify the WTO in advance 2. Consider the effects on importing countries’ food security 3. Consult if any member requests
India’s August 2023 Export Restrictions (major case): - Non-basmati white rice: Complete export ban (July 20, 2023) - Parboiled rice: 20% export duty - Broken rice: Earlier ban (September 2022) continued - Reason: Domestic food inflation, El Niño fears, low buffer stocks
India notified WTO but didn’t consult affected countries in advance.
Who Protested India’s Rice Export Restrictions?
- Bangladesh: ~35% of rice imports from India; scrambled for alternatives
- Philippines: Faced sudden shortfall in rice supplies
- West African countries (Senegal, Cameroon, Ivory Coast): dependent on Indian broken rice
- Indonesia, Malaysia: Sought alternative supplies
Several countries formally requested consultations under AoA Art. 12 — first major use of Art. 12 consultation requests against India.
India’s response: domestic food security is paramount; exported food is subject to sovereign decision.
The episode highlighted the global dependency on Indian rice exports and India’s responsibility as the world’s largest rice exporter (~40% of global rice trade in 2022)
Special and Differential Treatment for Developing Countries
S&DT Provisions in AoA
Market Access: - Smaller tariff cuts: 24% average (vs. 36%) - Minimum per product: 10% (vs. 15%) - Longer implementation: 10 years (vs. 6)
Domestic Support: - De minimis: 10% (vs. 5%) of product value - Input subsidies for low-income/resource-poor farmers — not counted in AMS (AoA Annex 2, Para 4) - Investment subsidies for agriculture — not counted
Export Competition: - Developing countries retain right to use export subsidies for transport, marketing to reduce marketing costs - Longer phase-out periods
India’s Use of S&DT
India fully utilises every S&DT provision:
- High bound tariffs — used the 10-year period to bind at high rates
- 10% de minimis — gives India more Amber Box space
- Input subsidy exemption — fertiliser subsidies targeted to small/marginal farmers (85% of India’s 140 million farm households are small/marginal)
- Investment subsidy exemption — RKVY, PMKSY, agricultural infrastructure investments
India’s 2017 WTO notification: India claimed the input subsidy exemption for fertiliser subsidies benefiting low-income, resource-poor farmers — this is the strongest legal shield available.
The Unfinished Doha Agriculture Agenda
What Doha Promised on Agriculture
The Doha Development Agenda (2001) mandated “substantial improvements” in:
- Market access — “substantial reductions in tariffs” including elimination of all tariff peaks and escalation
- Domestic support — “substantial reductions in trade-distorting support” especially Amber Box
- Export competition — “elimination with a view to phasing out all forms of export subsidies” ✅ (Done at Nairobi 2015)
The Sticking Points:
- USA: refuses to cut overall trade-distorting support (OTDS) significantly; Farm Bill politics
- EU: defensive on sugar, dairy, poultry
- India: demands strong SSM; resists deep tariff cuts on sensitive products
- China: joined WTO 2001; now major power with complex interests
Where We Are in 2026
The Doha Round as a “single undertaking” is dead.
What has happened: ✅ Export subsidy elimination (Nairobi 2015) ✅ Trade Facilitation Agreement (Bali 2013 / 2017) ✅ Peace Clause (Bali 2013) ✅ Fisheries subsidies (MC12 2022)
What has NOT happened: ❌ Substantial Amber Box cuts in US/EU ❌ Special Safeguard Mechanism (SSM) ❌ Permanent solution for public stockholding ❌ Market access improvements (tariff cuts on both sides)
After 30 years, agriculture remains the most politically contested sector in trade negotiations
AoA and Indian Farmer Welfare: An Assessment
Arguments that AoA helps Indian farmers
- Disciplines US/EU subsidies that depressed world prices for 40 years
- Eliminated EU/US export subsidies — raised world prices for wheat, sugar, dairy
- Forced transparency in domestic support programs
- Created a framework where India can challenge unfair competition
Arguments that AoA constrains India
- Constrains India’s ability to provide MSP support beyond de minimis
- FERP methodology unfair — systematically overestimates India’s “distortion”
- Tariff reduction pressure (even if gradual) limits India’s protection for sensitive crops
- Disciplines India’s export support while US subsidies continue under “Green Box” labels
Overall Assessment
India has navigated the AoA remarkably well:
- High bound tariffs = protection without WTO violation
- Peace Clause = MSP procurement protected
- S&DT = input subsidies, larger de minimis
- PM-KISAN = Green Box-compliant income support
- Active coalitions (G-33, G-20) = blocking unfavourable outcomes
India’s domestic support policy is primarily driven by food security and farmer welfare — WTO constraints are real but India has worked around them creatively.
The key challenge: permanent solution for public stockholding — if this fails, India’s MSP system remains legally vulnerable beyond the Peace Clause’s diplomatic protection
India Agricultural Trade Balance
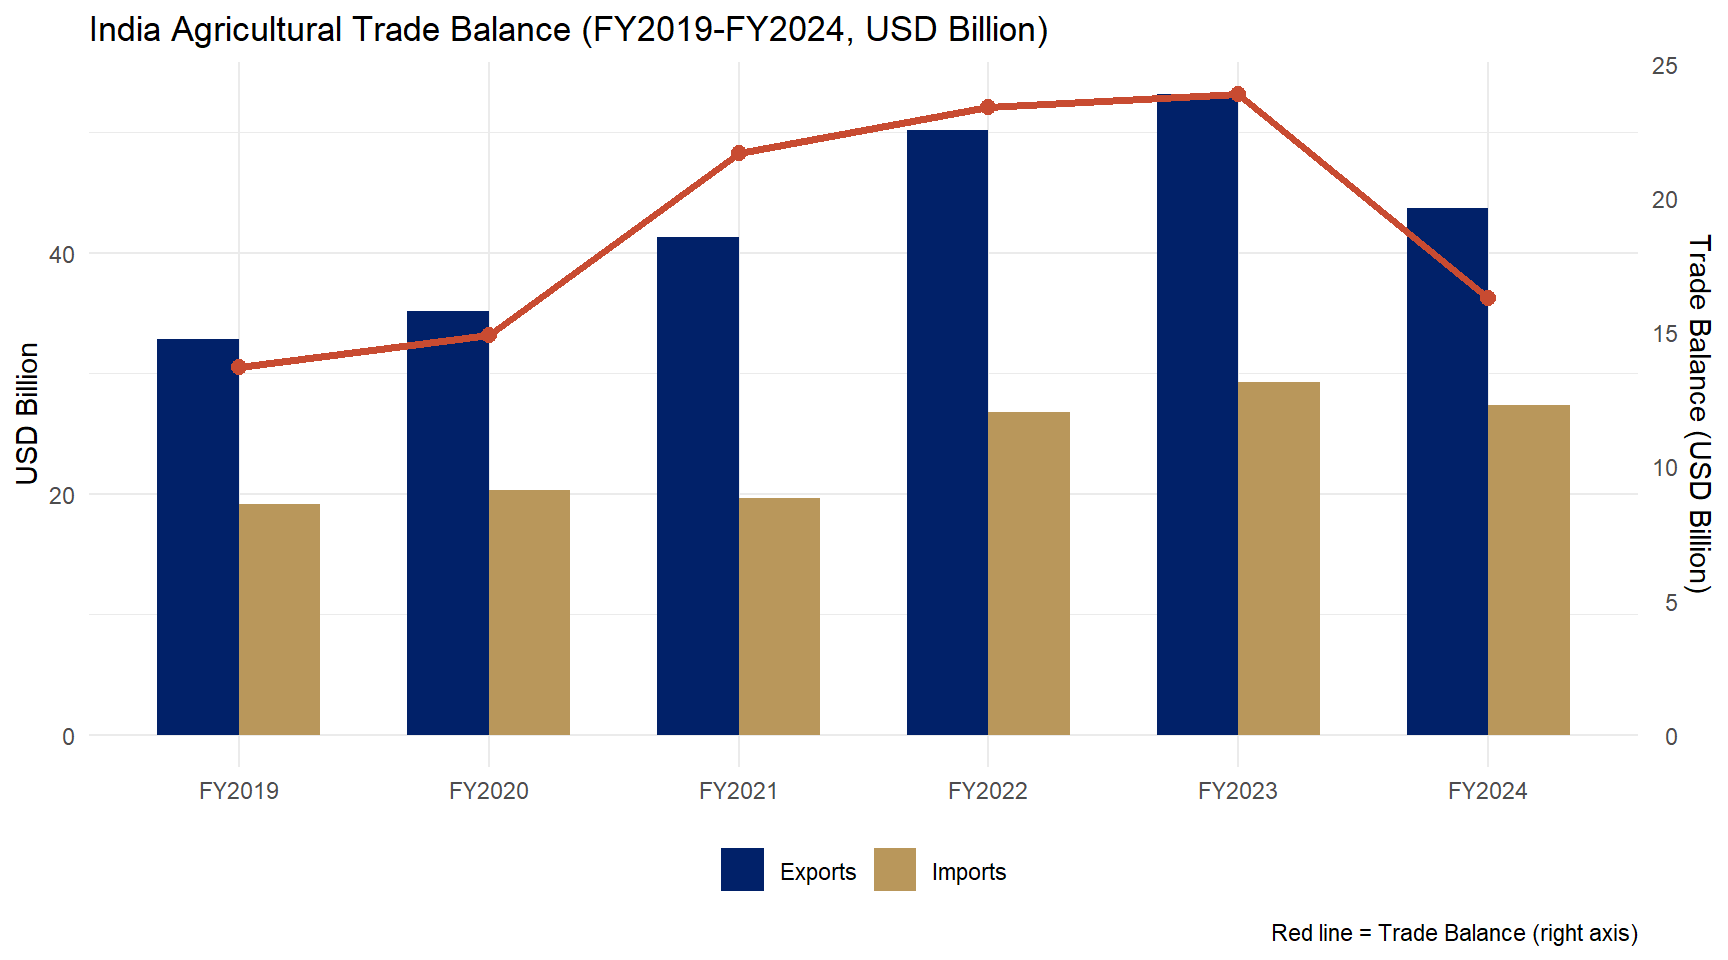
Figure 3: India Agricultural Trade Balance (FY2019-FY2024, USD Billion) Source: APEDA / DGCI&S.
Key Takeaways: Agreement on Agriculture
Seven Things to Remember from Lecture 14
AoA has three pillars: Market Access (tariffication + TRQs + reductions), Domestic Support (Green/Blue/Amber Boxes + de minimis), Export Competition (subsidy disciplines)
India’s bound tariffs average 113.5% — the “water” in the tariff is India’s primary agricultural protection instrument
Three Boxes: Green = unlimited (research, extension, decoupled payments); Blue = conditional (production-limiting); Amber = limited by de minimis (MSP procurement falls here)
India’s MSP procurement for rice likely exceeds 10% de minimis — protected only by the Peace Clause (Bali 2013)
FERP is the core injustice: Using 1986–88 world prices (depressed by US/EU subsidies) overstates India’s trade distortion. Updating FERP to current prices would solve India’s problem
Next Lecture: SPS Measures and Codex Alimentarius
Lecture 15 (August 4, 2026):
SPS Measures and Codex Alimentarius
Why Indian spices were pulled from Singapore supermarkets.Why India’s shrimp face detention in the USA. Why EU pesticide standards block Indian rice exports.
We will cover:
- SPS Agreement — scientific basis, Codex/OIE/IPPC
- Codex Alimentarius — the food code that governs market access
- India’s export rejection challenges: spices, shrimp, basmati rice
- Case studies: MDH/Everest spice scandal, Indian aquaculture
- India’s strategy for SPS compliance
Think About This
In April 2023, MDH and Everest — two of India’s most iconic spice brands — had their products banned in Singapore and Hong Kong.
The reason: ethylene oxide (a fumigant) detected above permitted limits.
What standard did they violate? Who sets these standards? Is this genuine food safety — or disguised protectionism?
We will answer all of these in Lecture 15.
Reading: - WTO SPS Agreement (full text) - FSSAI Annual Report 2023-24 - Spices Board of India Export Statistics - MPEDA: Aquaculture Export Performance Report
Appendix
Additional Resources
Further Reading
- International Economics — Salvatore (Ch. 12)
- International Economics — Appleyard & Field (Ch. 12)
- RBI/DGCI&S/APEDA databases for latest data
Key Data Sources
- DGCI&S: India’s merchandise trade
- RBI: Balance of payments data
- APEDA: Agricultural export statistics
- WTO: Tariff and trade databases
Econ 2203 | International Trade and Policy in Agriculture