Lecture 10: India’s External Sector

Econ 2203 | International Trade and Policy in Agriculture

Nithin M

Department of Development Economics

2026-06-27

India’s External Sector

A deep dive into India’s trade structure, agricultural trade, and balance of payments

Overview of India’s External Sector

India is a major trading nation — ranked among the top 20 exporters and importers globally.

Key FY2024 aggregates:

  • Merchandise exports: $437 billion
  • Merchandise imports: $677 billion
  • Trade deficit: −$240 billion
  • Services exports: $338 billion
  • Remittances: $120 billion

Why does this matter for agriculture?

India’s external sector shapes:

  • Price of edible oils (imports)
  • Farmer income (export demand)
  • Food inflation (rupee/import costs)
  • BoP sustainability

Merchandise Exports: Structure FY2024

Top 5 Merchandise Export Categories — FY2024

Category Value (USD B) Share of Total
Engineering goods $109 25.0%
Petroleum products $79 18.1%
Chemicals & Pharma $65 14.9%
Agriculture & allied $43.7 10.0%
Gems & jewellery $35 8.0%
Total merchandise $437

Agriculture contributes ~10% of total merchandise exports — a significant share ranking 4th by category.

Merchandise Export Composition: FY2024

Show R code
export_data <- data.frame(
  sector   = c("Engineering Goods", "Petroleum Products", "Gems & Jewellery",
               "Chemicals & Pharma", "Agriculture & Allied",
               "Textiles & Apparel", "Electronics", "Other"),
  value    = c(109.3, 78.5, 35.4, 65.2, 43.7, 33.4, 23.6, 17.9),
  category = c("Manufacturing", "Petroleum", "Manufacturing", "Manufacturing",
               "Agriculture", "Manufacturing", "Manufacturing", "Other")
)

export_data <- export_data |>
  dplyr::arrange(desc(value)) |>
  dplyr::mutate(sector = factor(sector, levels = sector))

ggplot(export_data, aes(x = sector, y = value, fill = category)) +
  geom_col(width = 0.75) +
  geom_text(aes(label = paste0("$", value, "B")), vjust = -0.3, size = 3.2) +
  scale_fill_manual(
    values = c("Manufacturing" = "#012169", "Petroleum" = "#B9975B",
               "Agriculture"   = "darkgreen", "Other"   = "grey60")) +
  labs(title = "India's Merchandise Exports by Sector, FY2024 (Total: ~$437B)",
       x = NULL, y = "USD Billion", fill = "Sector") +
  scale_y_continuous(limits = c(0, 125)) +
  theme(axis.text.x = element_text(angle = 30, hjust = 1),
        legend.position = "bottom")

Figure 1: India’s Merchandise Export Composition, FY2024 (USD billion) Source: DGCI&S / Ministry of Commerce and Industry, GoI.

Engineering goods ($109B) dominate — India’s shift toward capital goods exports. Agriculture ($44B) is the 5th largest category, but holds outsized strategic importance for rural incomes and food security diplomacy.

Merchandise Imports: Structure FY2024

Top Import Categories:

Category USD B
Petroleum & crude oil $232
Engineering goods $91
Electronic goods $80
Gold $47
Edible oils $14
Pulses $2.8

Agricultural import vulnerability

Edible oils at $14B represent a structural dependency — India imports ~60–65% of its edible oil needs.

This is India’s single largest agricultural import burden.

Merchandise Import Composition: FY2024

Show R code
import_data <- data.frame(
  sector    = c("Crude Oil &\nPetroleum", "Electronics &\nMachinery", "Gold & Silver",
                "Chemicals", "Coal", "Edible Oil",
                "Fertilizers", "Other"),
  value     = c(232.9, 171.0, 45.5, 34.2, 32.5, 14.2, 18.9, 127.8),
  vulnerable = c(TRUE, FALSE, FALSE, FALSE, TRUE, TRUE, TRUE, FALSE)
)

import_data <- import_data |>
  dplyr::arrange(desc(value)) |>
  dplyr::mutate(sector = factor(sector, levels = sector))

ggplot(import_data, aes(x = sector, y = value, fill = vulnerable)) +
  geom_col(width = 0.75) +
  geom_text(aes(label = paste0("$", value, "B")), vjust = -0.3, size = 3.2) +
  scale_fill_manual(
    values = c("TRUE" = "#cc0000", "FALSE" = "#012169"),
    labels = c("TRUE" = "Commodity vulnerability", "FALSE" = "Strategic import")) +
  labs(title    = "India's Merchandise Imports by Sector, FY2024 (Total: ~$677B)",
       subtitle = "Red = commodity import vulnerabilities (oil, edible oil, coal, fertilizers)",
       x = NULL, y = "USD Billion", fill = NULL) +
  scale_y_continuous(limits = c(0, 280)) +
  theme(axis.text.x = element_text(angle = 30, hjust = 1),
        legend.position = "bottom")

Figure 2: India’s Merchandise Import Composition, FY2024 (USD billion) Source: DGCI&S / Ministry of Commerce and Industry, GoI.

Vulnerability arithmetic: Crude oil ($233B) + Coal ($33B) + Fertilizers ($19B) + Edible oil ($14B) = ~$299B in commodity imports — 44% of total imports are subject to global commodity price shocks beyond India’s control.

Agricultural Exports FY2024: Breakdown

India’s total agricultural exports FY2024: ~$43.7 billion

Commodity USD B
Marine products $7.6
Non-basmati rice $4.6
Basmati rice $5.8
Processed food $4.8
Commodity USD B
Spices $3.7
Cotton $2.7
Coffee $1.2
Others ~$11.5

⚠️ Non-basmati rice exports were restricted from August 2023, significantly curtailing export earnings.

Agricultural Imports FY2024: Breakdown

Total agricultural imports: ~$28.2 billion

Edible Oils — $14 billion (largest component)

Oil USD B
Palm oil $9.5
Soybean oil $2.5
Sunflower oil $2.0

Other major imports:

  • Pulses: $2.8B
    (Canada, Australia key sources)
  • Fresh fruits: $1.8B
  • Cashew (raw): ~$1.5B
  • Spices (for re-export): ~$0.8B

India’s Net Agricultural Trade Position

Agricultural Trade Balance FY2024

Exports $43.7B − Imports $28.2B = Surplus +$15.5B

Five-Year Trend in Agricultural Trade Surplus:

FY Surplus (USD B)
FY2020 $17.0
FY2021 $20.0
FY2022 $25.0
FY2023 $15.8
FY2024 $15.5

The sharp drop from FY2022 to FY2023 reflects global commodity price corrections and India’s rice export restrictions.

India’s Key Merchandise Trading Partners

Top Export Destinations

  1. 🇺🇸 USA — $78B
  2. 🇦🇪 UAE — $36B
  3. 🇳🇱 Netherlands — $18B
  4. 🇨🇳 China — $17B
  5. 🇬🇧 UK — $11B

Top Import Sources

  1. 🇨🇳 China — $102B
  2. 🇦🇪 UAE — $53B
  3. 🇷🇺 Russia — $44B
  4. 🇺🇸 USA — $41B
  5. 🇸🇦 Saudi Arabia — $34B

China dominates imports — especially electronics, machinery, chemicals. India’s trade deficit with China alone is ~$85B. Reducing this is a stated policy goal.

India’s Trade Partners: FY2024

Show R code
exports_dest <- data.frame(
  country = c("USA", "UAE", "Netherlands", "China", "UK"),
  value   = c(77.5, 35.5, 18.2, 16.7, 11.1),
  share   = c(17.8,  8.1,  4.2,  3.8,  2.5)
)

imports_src <- data.frame(
  country = c("China", "UAE", "Russia", "USA", "Saudi Arabia"),
  value   = c(101.7, 53.2, 44.3, 40.8, 33.5),
  share   = c(14.7,   7.7,  6.4,  5.9,  4.8)
)

p1 <- ggplot(
  exports_dest |> dplyr::arrange(value) |>
    dplyr::mutate(country = factor(country, levels = country)),
  aes(x = country, y = value)) +
  geom_col(fill = "#012169", width = 0.7) +
  geom_text(aes(label = paste0("$", value, "B\n(", share, "%)")),
            hjust = -0.05, size = 3) +
  coord_flip() +
  labs(title = "Top Export Destinations", x = NULL, y = "USD Billion") +
  scale_y_continuous(limits = c(0, 92)) +
  theme_minimal(base_size = 10)

p2 <- ggplot(
  imports_src |> dplyr::arrange(value) |>
    dplyr::mutate(country = factor(country, levels = country)),
  aes(x = country, y = value)) +
  geom_col(fill = "#B9975B", width = 0.7) +
  geom_text(aes(label = paste0("$", value, "B\n(", share, "%)")),
            hjust = -0.05, size = 3) +
  coord_flip() +
  labs(title = "Top Import Sources", x = NULL, y = "USD Billion") +
  scale_y_continuous(limits = c(0, 125)) +
  theme_minimal(base_size = 10)

p1 + p2 +
  plot_annotation(
    title    = "India's Trade Partners, FY2024",
    subtitle = "USA = top export destination; China = top import source — strategic asymmetry"
  )

Figure 3: India’s Top 5 Export Destinations and Import Sources, FY2024 Source: DGCI&S / Ministry of Commerce and Industry, GoI.

Strategic asymmetry: India exports most to the USA ($78B) but imports most from China ($102B). The bilateral trade deficit with China alone (~$85B) exceeds India’s entire trade surplus with the USA.

Agricultural Trade Partners

Top Agri Export Markets

  1. USA — marine, spices, processed
  2. Bangladesh — rice, food grains
  3. UAE — rice, vegetables, spices
  4. China — cotton, marine, soybean
  5. Saudi Arabia — rice, spices

Rice dominates exports to South/SE Asia

Top Agri Import Sources

  1. Indonesia — palm oil
  2. Malaysia — palm oil
  3. Canada — pulses, lentils
  4. Australia — pulses, wheat (intermittent)
  5. Ukraine/Argentina — sunflower/soybean oil

India’s agricultural trade geography reflects its structural reliance on SE Asia for edible oils and the Anglosphere for pulses.

Services Exports: The Other Engine

Services exports FY2024: $338 billion — India’s invisible export superpower

Services Category USD B
IT/Software services $178
Business process & other $88
Travel & tourism $28
Financial services $11
Transport $14
Other services $19

Why this matters for agri trade:

IT export earnings provide forex that finances agricultural imports (edible oils, pulses).

Without IT services surplus, India’s BoP position would be far more stressed.

Services Trade Composition: FY2024

Show R code
services_data <- data.frame(
  # Source: RBI, Balance of Payments Statistics, FY2024
  category = c("Software &\nIT", "Business\nServices", "Travel\n(Tourism)",
               "Transport", "Financial\nServices", "Other\nServices"),
  exports  = c(177.7, 87.5, 28.1, 14.4, 10.7, 19.6),  # sum = 338.0
  imports  = c( 11.4, 54.8, 14.4, 41.8,  8.8, 42.8)   # sum = 174.0
)

svc_long <- tidyr::pivot_longer(services_data,
                                cols      = c(exports, imports),
                                names_to  = "type",
                                values_to = "value")

ggplot(svc_long, aes(x = category, y = value, fill = type)) +
  geom_col(position = "dodge", width = 0.75) +
  scale_fill_manual(
    values = c("exports" = "#012169", "imports" = "#B9975B"),
    labels = c("exports" = "Service Exports", "imports" = "Service Imports")) +
  labs(title    = "India's Services Trade, FY2024 (USD Billion)",
       subtitle = "Software/IT ($178B) dominates — India's 'comparative advantage' in skilled services",
       x = NULL, y = "USD Billion", fill = NULL) +
  theme(legend.position = "bottom",
        axis.text.x = element_text(angle = 15, hjust = 1))

Figure 4: India’s Services Trade Composition, FY2024 (USD billion) Source: RBI, Balance of Payments Statistics.

Revealed comparative advantage: India’s RCA in Software/IT services is extremely high — the $178B export vs $11B import reflects a structural specialisation. Combined with $88B in other business services, India’s services exports offset most of the merchandise trade deficit.

Remittances: India’s Hidden BoP Pillar

India is the world’s largest recipient of remittances

  • FY2024 inflows: $120 billion
  • Share of GDP: ~3.4%
  • Primary sources: Gulf countries (UAE, Saudi Arabia, Kuwait), USA, UK, Canada

Key sending states: Kerala, UP, Bihar, Rajasthan, Punjab

Remittances vs External Deficits

Goods trade deficit: −$240B
+ Services surplus: +$164B
= Net goods+services: −$76B
+ Remittances: +$120B

Remittances alone more than cover the net goods+services deficit.

Remittances: Global Comparison

Show R code
remit_data <- data.frame(
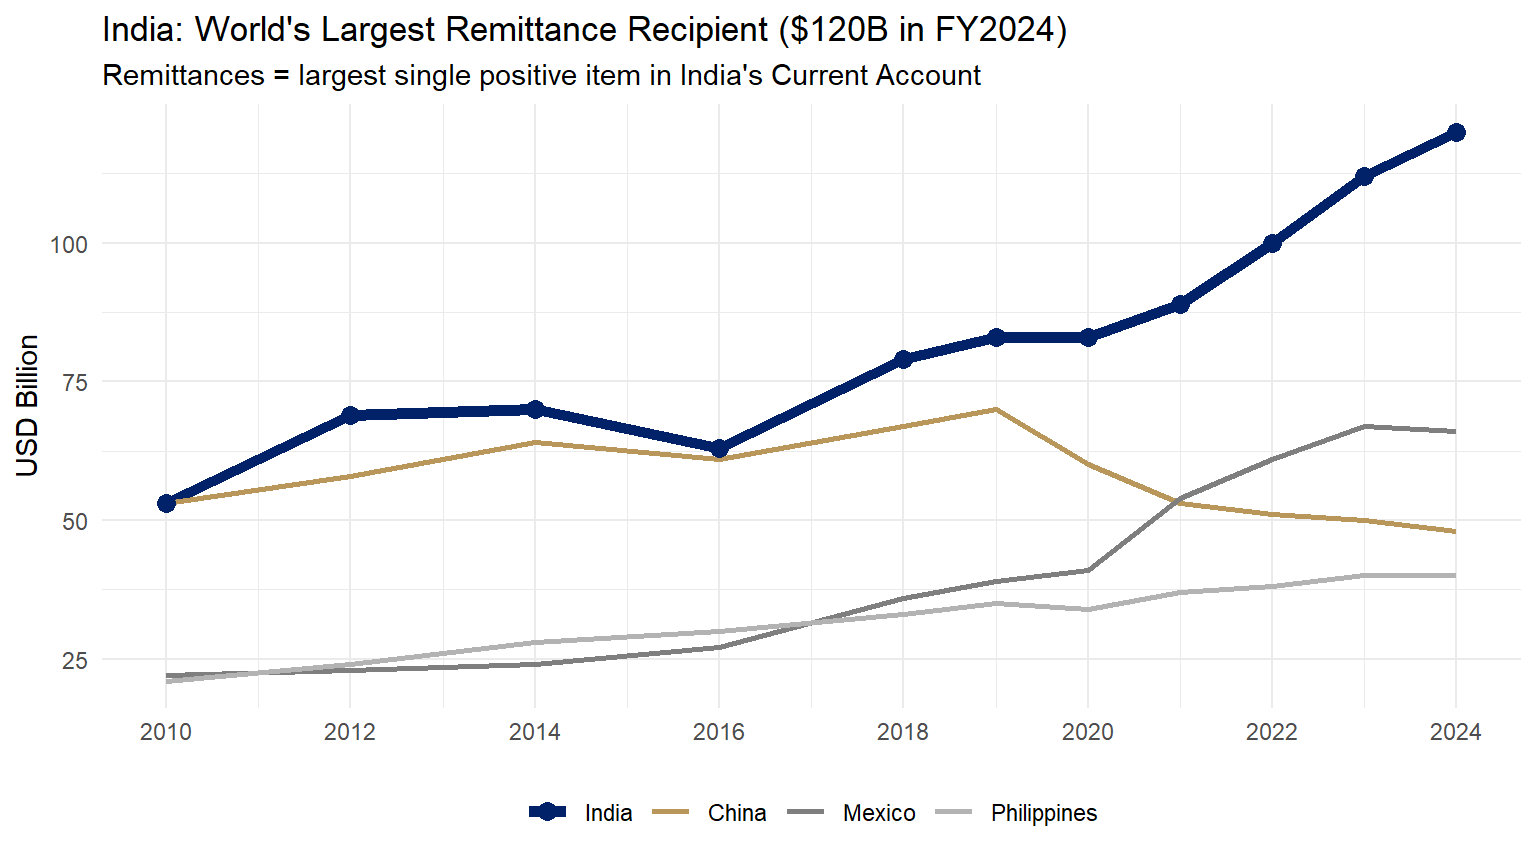
  year        = c(2010, 2012, 2014, 2016, 2018, 2019, 2020, 2021, 2022, 2023, 2024),
  india       = c(  53,   69,   70,   63,   79,   83,   83,   89,  100,  112,  120),
  china       = c(  53,   58,   64,   61,   67,   70,   60,   53,   51,   50,   48),
  mexico      = c(  22,   23,   24,   27,   36,   39,   41,   54,   61,   67,   66),
  philippines = c(  21,   24,   28,   30,   33,   35,   34,   37,   38,   40,   40)
)

remit_long <- tidyr::pivot_longer(remit_data, -year,
                                  names_to  = "country",
                                  values_to = "remit")

remit_long$country <- factor(
  remit_long$country,
  levels = c("india", "china", "mexico", "philippines"),
  labels = c("India", "China", "Mexico", "Philippines")
)

ggplot(remit_long, aes(x = year, y = remit, colour = country, linewidth = country)) +
  geom_line() +
  geom_point(data = subset(remit_long, country == "India"), size = 3) +
  scale_colour_manual(
    values = c("India" = "#012169", "China" = "#B9975B",
               "Mexico" = "grey50", "Philippines" = "grey70")) +
  scale_linewidth_manual(values = c("India" = 2, "China" = 1,
                                    "Mexico" = 1, "Philippines" = 1)) +
  scale_x_continuous(breaks = seq(2010, 2024, 2)) +
  labs(title    = "India: World's Largest Remittance Recipient ($120B in FY2024)",
       subtitle = "Remittances = largest single positive item in India's Current Account",
       x = NULL, y = "USD Billion",
       colour = NULL, linewidth = NULL) +
  theme(legend.position = "bottom")

Figure 5: India: World’s Largest Remittance Recipient (USD billion, 2010–2024) Source: World Bank, Migration and Remittances Data.

Gulf concentration risk: ~55% of India’s remittances come from Gulf Cooperation Council (GCC) countries. Oil price slumps → Gulf construction slowdowns → remittance drops → India’s CAD widens. The 1991 crisis featured exactly this channel.

Foreign Direct Investment (FDI) Flows

FDI inflows FY2024: ~$71 billion (gross)

Top recipient sectors:

  • IT & software: ~$18B
  • Financial services: ~$9B
  • Pharmaceuticals: ~$7B
  • Telecom: ~$6B
  • Agriculture & food processing: ~$3.6B

Agri FDI: $3.6B and growing

Focus areas: - Cold chain infrastructure - Food processing (100% FDI allowed) - AgriTech startups - Contract farming/supply chains

FDI in agri-food is growing but remains a small fraction — India’s farm sector still heavily domestic-capital-driven.

Forex Reserves: India’s Financial Buffer

India’s Foreign Exchange Reserves — FY2024: $645 billion

Components of forex reserves:

Component USD B
Foreign currency assets (FCA) $571
Gold $53
SDR holdings (IMF) $18
Reserve tranche position (IMF) $3

Import cover: ~11 months — well above the conventional safe threshold of 3 months. This gives India significant resilience against external shocks.

India’s 1991 Balance of Payments Crisis

The Crisis:

  • By early 1991, reserves fell to $1 billion (< 2 weeks of imports)
  • Iraq-Kuwait war raised oil import bill
  • Gulf remittances fell sharply
  • Fiscal deficit had grown unsustainably
  • Credit rating downgrades; capital flight

India’s Response:

  • IMF bailout loan ($2.2B)
  • Gold pledged as collateral (47 tonnes)
  • Two-step rupee devaluation (25%)
  • Structural adjustment → liberalization reforms

1991 as a turning point

The crisis forced India to:

  • Open up to FDI
  • Dismantle import licensing
  • Devalue rupee
  • Phase out industrial licensing

Agricultural trade also liberalized — QRs on agri imports phased out by 2001 (WTO bound).

Current Account Sustainability

Current Account Deficit (CAD) FY2024: approximately −0.7% of GDP

India’s CAD trend:

Year CAD (% GDP) Assessment
FY2012 −4.8% Dangerously high
FY2019 −2.1% Elevated
FY2022 −1.7% Moderate
FY2023 −2.0% Moderate
FY2024 −0.7% Comfortable

A CAD of −0.7% GDP is considered sustainable. The “safe zone” is generally under −3% for an economy of India’s size and growth rate.

The Edible Oil Vulnerability: A Policy Case Study

The structural problem:

India produces ~10 million tonnes of edible oil domestically but consumes ~24 million tonnes.

The 14 million tonne import gap = $14B foreign exchange outflow annually.

Source concentration risk: - 90% of palm oil from Malaysia & Indonesia - Subject to export bans, price manipulation, climate shocks

Policy responses:

  1. PM KUSUM — promote oilseed cultivation
  2. National Mission on Edible Oils (Oilpalm) — expand domestic oil palm to NE states
  3. Import duty manipulation — lower duties during inflation
  4. Buffer stock policy — proposed but not implemented

Rice Export Restrictions: A Policy Dilemma

August 2023: India bans non-basmati white rice exports

Rationale: - Domestic rice prices rising - Food security concerns ahead of state elections - Erratic monsoon raised supply uncertainty

Impact: - India’s rice exports fell sharply (India = 40% of global rice trade) - Global rice prices surged 30–40% - Indonesia, Philippines, West Africa faced food price spikes - India’s agri export earnings fell by billions

The trade-off:

Restrict exports Let exports flow
Lower domestic prices Higher farmer income
Better food security Better forex earnings
Harms trading partners Global price stability

Classic food security vs. trade earnings dilemma — central to agri trade policy

India’s Balance of Payments: Summary Picture

BoP Current Account FY2024 (approximate):

Item USD B
Merchandise exports +437
Merchandise imports −677
Trade balance −240
Services exports +338
Services imports −167
Services balance +171
Primary income (net) −32
Secondary income (remittances) +120
Current Account Balance ~−17

CAD of ~$17B on a GDP of ~$3.4 trillion = about −0.5% to −0.7% GDP. Healthy and sustainable.

India’s Global Trade Rankings

India’s position in global trade (WTO 2024):

Merchandise trade: - Exports: 17th largest globally - Imports: 10th largest globally - Share of world trade: ~1.8%

Services trade: - Services exports: 7th globally - IT services: Largest global exporter

Agriculture specifically: - Rice: #1 global exporter (40% share) - Spices: Top 3 globally - Cotton: Top 3 globally - Seafood: Top 10 globally

India punches above its weight in agricultural exports relative to its overall merchandise trade share.

Structural Challenges in India’s External Sector

Key vulnerabilities:

  1. Energy import dependence — crude oil $232B; geopolitical risk

  2. Edible oil import dependence — $14B; food inflation risk

  3. Electronic goods deficit — $80B; reflects low domestic manufacturing

  4. Gold demand — $47B; compresses CAD but reflects domestic saving patterns

  5. China trade deficit — ~$85B; supply chain dependency

Agricultural Sector’s Role in India’s External Sector

Agriculture in India’s external sector: 3 key roles

1. Forex earner: $43.7B in exports — supports BoP, provides farmer income linkage to global prices

2. Forex user: $28.2B in imports — edible oils and pulses; food security imperative but forex cost

3. Policy instrument: Government uses export/import restrictions to manage domestic food prices — with global spillover effects (India = swing supplier in rice, sugar, onions)

The net surplus of $15.5B means agriculture is a net contributor to India’s BoP — a valuable buffer.

Looking Ahead: India’s External Sector Goals

India’s trade policy objectives (2025–2030):

  • Merchandise exports target: $1 trillion by FY2030
  • Agricultural export target: $100 billion by 2030
  • Increase oilseed domestic production (reduce $14B import bill)
  • Value-added processed food exports
  • Agri-GI tags to premium global markets

Key Takeaways — Lecture 10

Five things to remember:

  1. India’s merchandise trade deficit is $76B but is more than offset by services surplus ($171B) and remittances ($120B)

  2. Agriculture contributes a net surplus of $15.5B — making it a positive contributor to the BoP

  3. Edible oil imports ($14B) are India’s single largest agricultural vulnerability — a structural food security and forex risk

  4. India is the world’s largest rice exporter — and unilateral export restrictions have significant global price consequences

  5. Forex reserves at $645B (11 months import cover) provide substantial external sector resilience; a far cry from the 1991 crisis

Next Lecture: Foreign Exchange Rates and Determination

Lecture 11 (July 7, 2026): Foreign Exchange — Rates and Determination

We will cover:

  • What is the exchange rate and why does it matter?
  • Nominal vs. real exchange rate
  • PPP theory and why the rupee “should” depreciate
  • Covered and uncovered interest parity
  • How exchange rates affect agricultural exporters and importers

Appendix

Additional Resources

Further Reading

  • International Economics — Salvatore (Ch. 13-14)
  • International Economics — Appleyard & Field (Ch. 13-14)
  • RBI/DGCI&S/APEDA databases for latest data

Key Data Sources

  • DGCI&S: India’s merchandise trade
  • RBI: Balance of payments data
  • APEDA: Agricultural export statistics
  • WTO: Tariff and trade databases