Lecture 2: Features of International Trade

Econ 2203 | International Trade and Policy in Agriculture

Nithin M

Department of Development Economics

2026-05-02

Recap: Lecture 1

Three things to remember from last week

  1. International trade = cross-border exchange of goods, services, and capital; driven by differences in resource endowments, technology, and opportunity costs

  2. India’s position: 18th-largest merchandise exporter; agricultural exports ~$43.7B (FY2024); structural trade surplus in agriculture of ~$15.5B

  3. Agricultural trade is special — food security concerns, perishability, seasonality, and powerful political economy shape how governments intervene

Today’s agenda

  • What distinguishes international trade from domestic trade?
  • How open is India to global trade — and how has this changed over time?
  • Advantages and risks of participating in global markets

India’s Growing Trade Openness

Show R code
library(ggplot2)

openness <- data.frame(
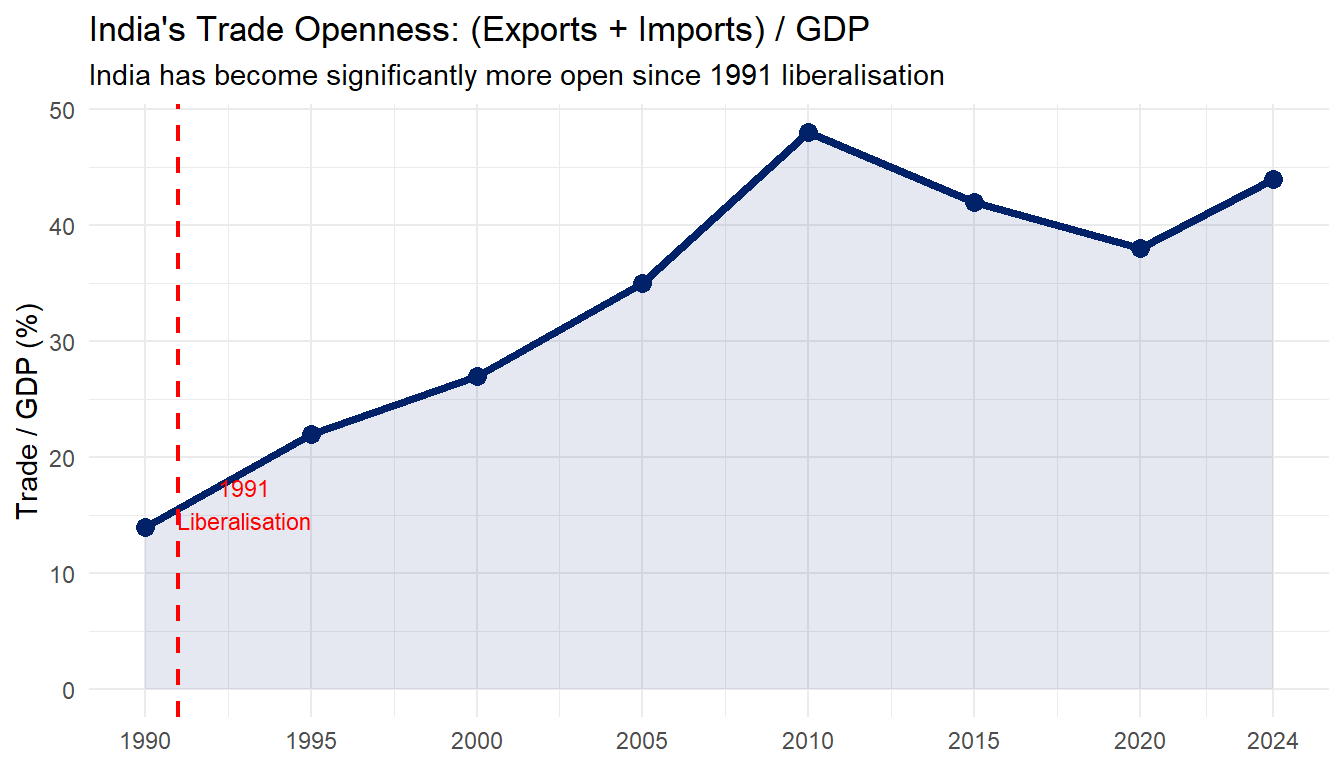
  year = c(1990, 1995, 2000, 2005, 2010, 2015, 2020, 2024),
  trade_gdp = c(14, 22, 27, 35, 48, 42, 38, 44)
)

ggplot(openness, aes(x=year, y=trade_gdp)) +
  geom_line(color="#012169", linewidth=1.5) +
  geom_point(color="#012169", size=3) +
  geom_area(fill="#012169", alpha=0.1) +
  geom_vline(xintercept=1991, linetype="dashed", color="red", linewidth=0.8) +
  annotate("text", x=1993, y=16, label="1991\nLiberalisation", color="red", size=3) +
  labs(title="India's Trade Openness: (Exports + Imports) / GDP",
       subtitle="India has become significantly more open since 1991 liberalisation",
       x=NULL, y="Trade / GDP (%)") +
  scale_x_continuous(breaks=c(1990,1995,2000,2005,2010,2015,2020,2024)) +
  theme_minimal(base_size=11)

Figure 1: India: Trade Openness (Exports + Imports as % of GDP) Source: World Bank, World Development Indicators (WDI).

Trade/GDP rose from 14% (1990) to 44% (2024) — India is significantly more integrated into the global economy post-liberalisation.

Features That Make International Trade Distinct

International trade is not simply domestic trade “at a larger scale.” Six features create unique challenges:

(a) Geographical separation — Long distances → higher transport costs, insurance, cold-chain requirements, longer lead times

(b) Different currencies — Each transaction requires currency conversion; exchange rate fluctuations create financial risk

(c) Factor immobility — Labour and capital cannot move freely across borders — immigration controls, capital account restrictions

(d) Multiple political jurisdictions — Each country sets its own trade policy — tariffs, quotas, export bans; no single governing authority

(e) Different legal systems & culture — Food labelling laws, packaging standards, contract enforcement vary widely

Feature 1: Factor Immobility

Why factors don’t move freely

  • Labour: Visa restrictions, language barriers, immigration quotas
    • India sends ~8 million workers to Gulf countries — under strict bilateral agreements, not free movement
  • Capital: FDI restrictions, capital account controls, regulatory hurdles
    • India maintains partial capital account convertibility (RBI-regulated)
  • Land: Completely immobile by definition

India case: Gulf remittances — Indian workers (largely from Kerala, UP, Bihar) work in UAE, Saudi Arabia, Kuwait — sending back ~$120 billion in remittances (FY2024), making India the world’s largest remittance recipient.

Feature 1: Factor Immobility (cont.)

Why this matters for trade theory

  • Classical models (Ricardo, H-O) assume factor immobility across borders
  • This is what makes trade in goods a substitute for factor flows
  • If labour moved freely, there would be less need to trade goods

Feature 2: Currency and Exchange Risk

The exchange rate problem

  • Indian exporters price in USD (world standard for commodities)
  • Their costs are in Indian Rupees (INR)
  • If INR appreciates (e.g., ₹80 → ₹75 per USD), the same USD revenue converts to fewer rupees → profit squeezed
  • If INR depreciates (₹80 → ₹85), exporters gain; importers lose
Year INR/USD Year INR/USD
2000 45 2020 75
2010 46 2024 83–84
2015 65

Agricultural export example: A Punjab wheat exporter quotes $250/tonne FOB Mumbai. At ₹80/USD → realises ₹20,000/tonne; at ₹75/USD → only ₹18,750/tonne. A 5% INR appreciation = 6.25% reduction in rupee revenue — potentially wiping out margins. Hedging tools: Forward contracts, futures on NSE/BSE, ECGC insurance.

Internal vs International Trade: Key Differences

Dimension Internal (Domestic) Trade International Trade
Factor mobility Labour and capital move freely Highly restricted — visas, FDI rules
Currency Single national currency Multiple currencies; exchange rate risk
Political jurisdiction One government, one legal system Multiple governments, international law
Trade barriers None within India (post-GST) Tariffs, quotas, SPS, NTBs
Transport costs Relatively low Higher — ocean freight, insurance, customs
Documentation Invoice, transport document B/L, L/C, Certificate of Origin, SPS certificate
Market size Limited to one country Global — 195 countries
Dispute resolution Domestic courts WTO DSM, bilateral/regional bodies

Key insight: India’s internal trade was itself fragmented before GST (2017) — state-level taxes created internal barriers. International trade faces all these barriers and more.

The Gravity Model of Trade

Inspired by Newton’s law of gravitation:

\[T_{ij} = G \cdot \frac{Y_i \cdot Y_j}{D_{ij}^2}\]

Where \(T_{ij}\) = trade between \(i\) and \(j\); \(Y_i, Y_j\) = GDP; \(D_{ij}\) = distance.

Interpretation: Trade is proportional to economic size and inversely proportional to distance.

Partner GDP Distance Trade rank
USA Very large Far #1 export dest.
China Very large Medium #1 import source
UAE Medium Close #2 export dest.
Bangladesh Small Very close #5 export dest.

UAE ranks highly despite moderate GDP: it is a regional trade hub + large Indian diaspora creates demand for Indian food products.

Advantages of International Trade for India

For producers and the economy

  1. Wider market — Indian basmati rice sold in 150+ countries; domestic market alone could not absorb export volumes
  2. Access to unavailable inputs — India imports potash fertiliser (not produced domestically in sufficient quantity)
  3. Technology transfer — FDI brings modern food processing technology
  4. Employment generation — Marine product sector employs ~1.5 million workers, mostly coastal women
  5. Foreign exchange earnings — Agricultural exports earn $43.7B; crucial for financing oil imports

Rice example: India is the world’s largest rice exporter (~22 million tonnes in 2022). Exports earn ~$10B forex and support 30 million paddy farmers.

Disadvantages and Risks of International Trade

Economic risks

  1. Import dependence — India’s edible oil dependence (60–65% imported) exposes inflation to global price shocks
  2. Dumping risk — China dumped cheap steel and tomato paste in India; domestic industries harmed
  3. BoP strain — India’s merchandise deficit ~$241B (FY2024); requires large capital inflows to finance
  4. Domestic industry harm — Cheap palm oil lowered demand for domestic groundnut oil

Policy lesson: The goal is not to maximise trade at all costs, but to manage trade so its gains exceed its disruption costs.

Case Study: India’s Edible Oil Import Dependence

The structural problem

  • India consumes ~24–25 million tonnes of edible oil per year
  • Domestic production: ~9–10 million tonnes
  • Import requirement: ~14–15 million tonnes (60–65% of need)
  • Cost: ~$12–14 billion per year (FY2024)
Oil type Source Share
Palm oil Indonesia, Malaysia ~65%
Soybean oil Argentina, Brazil ~15%
Sunflower oil Ukraine, Russia ~15%

Lesson: Import dependence in a strategic food commodity creates price transmission vulnerability. PM KISAN Oilseeds Mission (2023) aims to double domestic production by 2030.

Case Study: India’s Rice Export Ban (2023)

What happened:

  • India banned non-basmati white rice exports in August 2023
  • Rationale: control domestic food inflation, protect consumers
  • India is the world’s largest rice exporter — ~22 million tonnes/year

Who gained: Urban consumers (domestic prices stabilised); RBI’s CPI inflation target

Who lost: Paddy farmers (domestic price fell); rice millers and exporters (contracts cancelled); Bangladesh and West Africa (supply shortage; global prices rose +20%)

The ban caused a global rice price spike of ~20% — demonstrating India’s market power as the world’s dominant rice exporter. India partially reversed the ban for specific grades in early 2024 under WTO member pressure.

This is a classic domestic policy vs. trade commitment conflict — a recurring theme in agricultural trade policy.

Government Policy in Agricultural Trade

Price support and export competitiveness

  • MSP: Raises domestic price above world price → may make exports uncompetitive without subsidy
  • Export bans: Rice ban (non-basmati) August 2023; wheat ban (May 2022) — protect domestic prices, hurt exporters
  • Import duties on pulses and oilseeds: Reduced to zero during 2021–22 price shock; raised again when harvest recovered
  • TRQs: Limited quantities at low duty; higher duty beyond the quota

Core tension: India’s domestic farm support policies often conflict with WTO commitments on export subsidies and import duties — the AoA bindings create real constraints (Lecture 12).

Trade Finance and Documentation

Key trade documents

  • Bill of Lading (B/L): Shipping company’s receipt; title document for goods
  • Letter of Credit (L/C): Bank’s guarantee of payment; protects both parties
  • Certificate of Origin: Proves provenance; needed for preferential duty under FTAs
  • Phytosanitary Certificate: Certifies plants/plant products are pest-free
  • SPS Compliance Certificate: Confirms pesticide residues, aflatoxin levels meet standards

Summary and Key Takeaways

What we covered today

  • International trade has 6 key features distinguishing it from domestic trade: geographic separation, currency risk, factor immobility, multiple jurisdictions, cultural/legal differences, and greater uncertainty
  • India’s trade openness rose from 14% of GDP (1990) to 44% (2024) — driven by 1991 liberalisation
  • Factor immobility is the fundamental reason countries trade goods rather than simply moving workers
  • Currency risk directly affects agricultural export profitability — a 5% INR appreciation can wipe out export margins
  • Edible oil dependence is India’s most significant agricultural import vulnerability: $12–14B/year

Discussion Question

“India has a comparative advantage in rice. Bangladesh also exports rice. How can both export the same commodity?”

Think through:

  • Is India’s advantage in all varieties of rice?
  • Can a country export and import the same good? (Intra-industry trade)
  • How do quality differentiation, variety, and destination markets matter?
  • What does the rice export ban tell us about the limits of comparative advantage as a policy guide?

Answer preview: Intra-industry trade, quality segmentation (basmati vs parboiled), and market access geography all allow two countries to simultaneously export similar products. We formalise this in Lecture 6.

Next Lecture: Lecture 3

Theories of International Trade I — Mercantilism and Absolute Advantage (May 12, 2026)

We will cover:

  • Mercantilism (1500–1750): wealth = gold, maximise exports, minimise imports — and why it is fundamentally flawed
  • Colonial trade: India’s experience under British mercantilism — the “drain of wealth” thesis (Dadabhai Naoroji)
  • Adam Smith (1776): Absolute advantage — trade based on genuine productivity differences
  • Numerical example: India vs Bangladesh in rice and jute
  • Limitations of absolute advantage — setting up for Ricardo

Appendix

Additional Resources

Further Reading

  • International Economics — Salvatore (Ch. 1)
  • International Economics — Appleyard & Field (Ch. 1)
  • RBI/DGCI&S/APEDA databases for latest data

Key Data Sources

  • DGCI&S: India’s merchandise trade
  • RBI: Balance of payments data
  • APEDA: Agricultural export statistics
  • WTO: Tariff and trade databases